Key Issues
- Real-time, in situ process understanding in accordance with the PAT initiative
- Off-line laboratory and on-line process analysis utilizing the same technology
- Qualitative analysis of solid forms and quantitative analysis of composition
Introduction
The U.S. FDA’s process analytical technology (PAT) initiative offers a framework for “quality by design” implementation. In this initiative, analyzer technologies can be utilized to obtain real-time, in situ full comprehension of industrial pharmaceutical processes. This knowledge can be used to develop effective critical quality attributes, control limits, and rational specifications. Raman spectroscopy is distinctively useful for PAT applications due to the fact it is just as suitable for on-line and inline process analysis and off-line laboratory analysis.
Amid the drug-delivery systems that are growing progressively more important are hot-melt extruded formulations which deliver therapeutic compounds topically. While numerous other analytical methods require extraction of excipients and plasticizers, Raman spectroscopy does not need any sample preparation.
Experimental
In this article, a Kaiser Raman analyzer fitted with a RamanRxn probe head and a non-contact optic was investigated for use in analyzing an extruded polyethylene oxide (PEO) film containing ketoprofen, in both a moving process line and a laboratory setting.
Off-line analysis
Off-line analysis was conducted by focusing the probe head and noncontact optic on the extruded film. The exposure time for each spectrum was 30 s. The unprocessed off-line Raman spectra of the ketoprofen samples are illustrated in Figure 1.
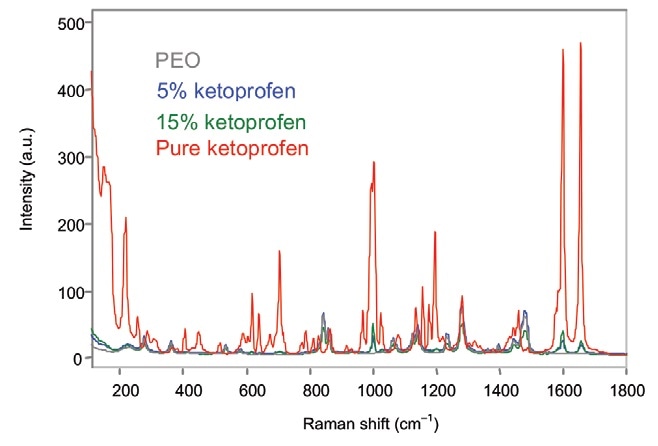
Figure 1. Off-line Raman spectra of ketoprofen films. Image Credit: Kaiser Optical Systems, Inc.
To remove any baseline variation, a second-derivative treatment was applied to the data. The major area of variance was between 985 and 1030 cm–1 (Figure 2).
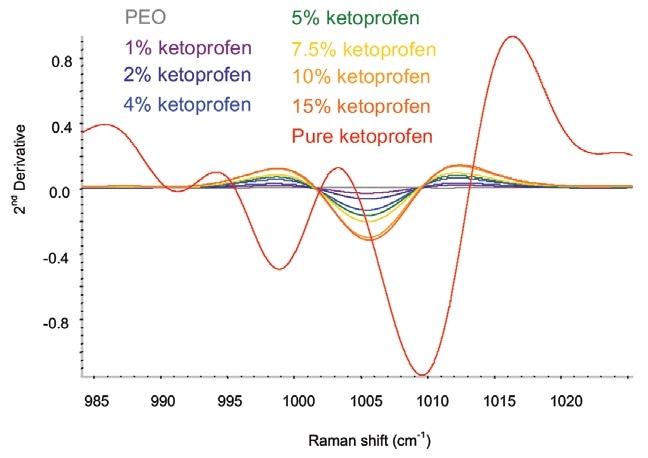
Figure 2. Second-derivative ketoprofen spectra in the spectral area of interest. Image Credit: Kaiser Optical Systems, Inc.
The ketoprofen in the extruded film displays spectral differences relative to the crystalline pure sample. The spectral changes corroborate the interpretation that the ketoprofen becomes amorphous when extrusion occurs. Therefore, Raman spectroscopy produces qualitative information concerning the solid form of the sample as well as quantitative information on the composition.
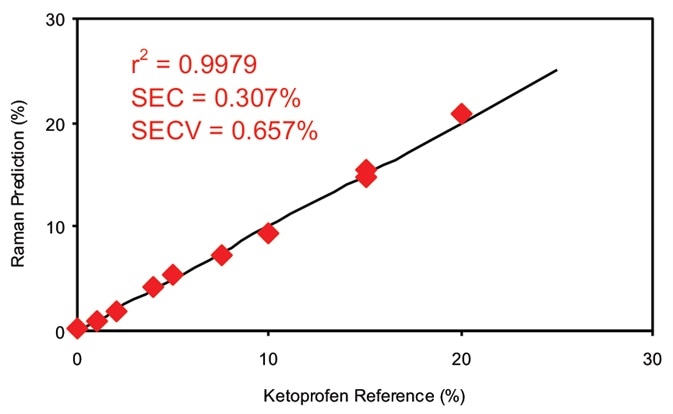
Figure 3. Calibration data for off-line ketoprofen measurements. SEC = Standard error of calibration; SECV = Standard error of cross validation. Image Credit: Kaiser Optical Systems, Inc.
Figure 3 illustrates the calibration results for off-line analysis of the ketoprofen films. With a multiple linear regression (MLR) technique, the calibration coefficient acquired for this dataset was 0.9979, utilizing a primary wavelength shift of 998 cm–1 and a secondary wavelength shift of 886 cm–1. The second band was used as a ratio band. The superb calibration coefficient suggests that the data gathered by Raman spectroscopy correlate well to this sample’s known amount of ketoprofen.
On-line analysis
On-line analyses were conducted using the same Kaiser Raman analyzer by obtaining data from the film as it was extruded. The Kaiser Raman probe was mounted above the moving film and spectra were obtained continually. For each spectrum in the on-line analysis, the exposure time was 60 s.
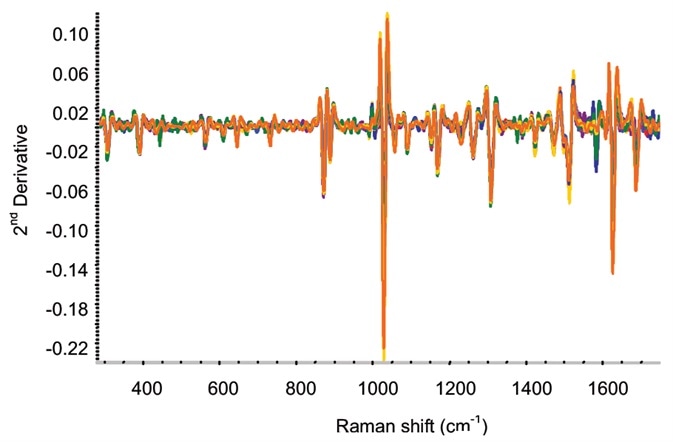
Figure 4. Second-derivative spectra for on-line ketoprofen measurements. Several spectra each are included for ketoprofen contents of 2.5%, 5%, 7.5%, 10%, 15%, and 20%. Image Credit: Kaiser Optical Systems, Inc.
Second-derivative spectra from the ketoprofen extrusion are illustrated in Figure 4. As more noise was detected for the moving film line in comparison to the off-line measurements, in the data analysis partial least squares (PLS) models were utilized.
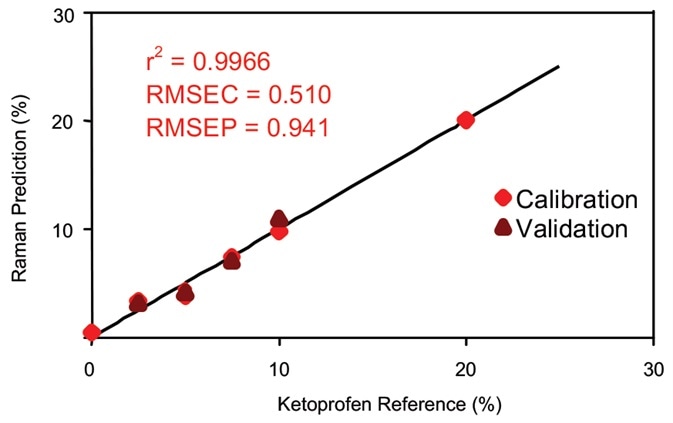
Figure 5. Calibration data for on-line ketoprofen measurements. RMSEC = Root mean squared error of calibration; RMSEP = Root mean squared error of prediction. Image Credit: Kaiser Optical Systems, Inc.
The correlation curve is displayed in Figure 5. The correlation coefficient utilizing a three-factor PLS equation and a wavelength shift range of 506 to 1616 cm–1 was 0.9966, signifying an outstanding agreement with the sample’s known ketoprofen content. The data was normalized to the peak’s area, between 1409 and 1524 cm–1.
Conclusions
Raman spectroscopy has been demonstrated to be ideally suited for this PAT application, allowing real-time process understanding. The data gathered by Raman spectroscopy, both on-line and off-line, agrees excellently with these samples’ known ketoprofen content. Therefore, Raman spectroscopy has been demonstrated to be effective for analyzing both on-line process lines and off-line laboratory QA/QC samples, streamlining the development of process analytics and calibration models.
References
- https://www.fda.gov/
About Kaiser Optical Systems, Inc.
Kaiser Optical Systems, Inc. (Kaiser), an Endress+Hauser company, is the global leader in Raman spectroscopic instrumentation for laboratory, process, and manufacturing environments. Our solutions harness the powerful analytical information of Raman Spectroscopy to help our customers understand, measure, and control their chemistries.
As a trusted partner in Raman for over 30 years, Kaiser has a long history in production, including GMP manufacturing, with many proven successes. Our unmatched expertise, high quality solutions, and exceptional customer service sets Kaiser far above any other Raman option in the marketplace. Kaiser Raman technology is currently used throughout the chemical, food and beverage, oil and gas, pharmaceutical, and biopharmaceutical industries to optimize process efficiency and deliver quality products. Kaiser’s manufacturing and headquarters facility is in Ann Arbor, Michigan.
Sponsored Content Policy: News-Medical.net publishes articles and related content that may be derived from sources where we have existing commercial relationships, provided such content adds value to the core editorial ethos of News-Medical.Net which is to educate and inform site visitors interested in medical research, science, medical devices and treatments.