FTIR can be used to reveal the composition of solids, liquids and gases. It achieves this by determining the degree of similarity between a sample spectrum and a reference, providing a robust means of identifying unknown materials, confirming the identity of incoming or outgoing production materials, and ascertaining a sample’s relative purity.
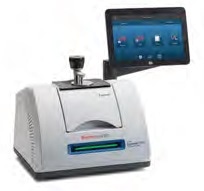
Thermo Scientific™ Nicolet™ Summit FTIR spectrometer with touchscreen and OMNIC™ Paradigm™ Software. Image Credit: Thermo Fisher Scientific – Materials & Structural Analysis
This article explores the use of advanced software to enhance spectral comparison further, ensure a reproducible workflow and provide useful reports for a range of purposes.
One of the most common applications of FTIR spectroscopy involves mathematically comparing the spectrum from a sample to that of known and reliable reference material.
This process of spectral comparison is often employed as a verification method for incoming materials, confirmation that a patented chemical is unique or as evidence in a court of law.
The most basic and dependable metric for determining the similarity between infrared spectra is known as its ‘correlation value.’ A perfect correlation is equivalent to a value of 100, with even a small difference between the two spectra lowering this value.
Even the most state-of-the-art FTIR spectrometers rarely achieve a perfect correlation of 100, and most labs will regard a correlation value of 95 or greater as a strong spectral match.
Most industrial environments aim to verify that the sample falls within an acceptable level of purity in relation to the accepted reference standard.
Discussion
Using the QCheck function to compare spectra
The Thermo Scientific™ OMNIC™ Paradigm Software instrument control software is designed to acquire spectral and other data, analyze samples, generate workflows and support users to automate analyses.
The software’s QCheck function allows users to easily compare a spectrum to one or more reference spectra.
In the example presented here, the QCheck function was used to confirm that a plastic sample is polystyrene - the specified material. Using the OMNIC Paradigm Software, spectra from the polystyrene reference material were overlaid with that of the plastic sample.
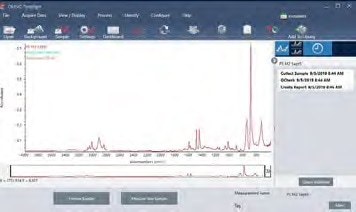
Figure 1. Sample spectrum and best match from QCheck analysis. Image Credit: Thermo Fisher Scientific – Materials & Structural Analysis
Visually, the two spectra appear similar, exhibiting peak locations and intensities with a good degree of overlap (Figure 1). The QCheck function is able to mathematically calculate the correlation between these two spectra.
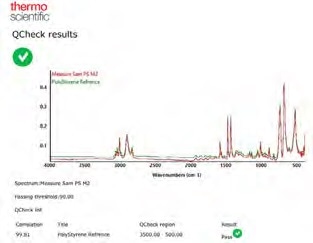
Figure 2. An example QCheck analysis report. Image Credit: Thermo Fisher Scientific – Materials & Structural Analysis
This is displayed alongside the QCheck analysis in a report, with the example here presenting a high correlation value of 99.81 (Figure 2).
QCheck analysis provides users with a rapid, dependable method and an algorithm that can be optimized to meet specific user needs.
For example, it can be used to select the most appropriate spectral region for the application, ascertaining the level of signal averaging required to ensure an acceptable spectrum as well as selecting an appropriate pass or fail correlation value.
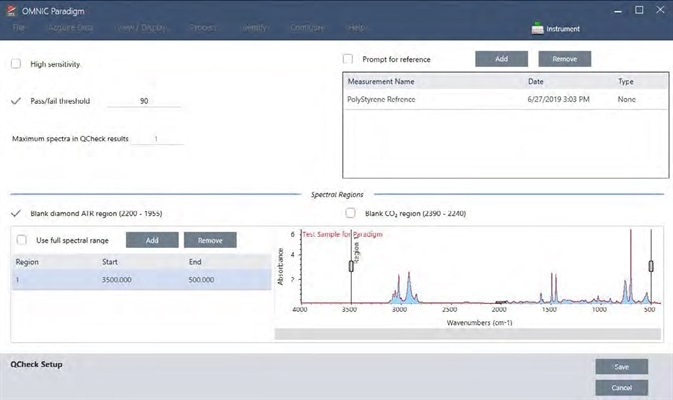
Figure 3. The setup screen for the QCheck analysis. Image Credit: Thermo Fisher Scientific – Materials & Structural Analysis
Figure 3 shows the range of variables that can be optimized within the QCheck function. The most popular of these variables allows users to select specific regions to conduct the correlation comparison.
Using a QCheck workflow
The OMNIC Paradigm Software enables the straightforward analysis of single samples, with QC laboratories frequently documenting analysis steps in a Standard Operating Procedure to ensure the consistent analysis of multiple samples.
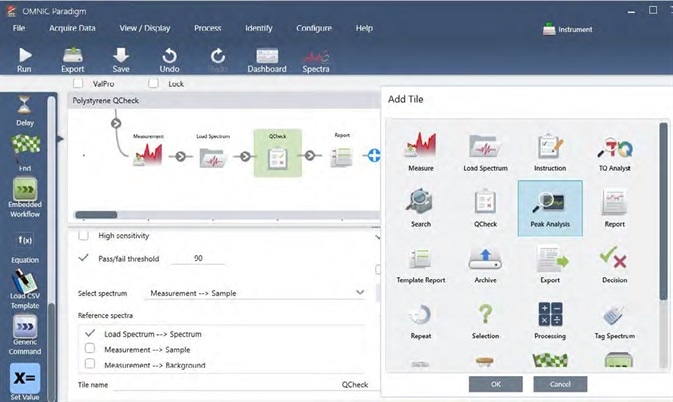
Figure 4. Workflow template and a list of possible functions. Image Credit: Thermo Fisher Scientific – Materials & Structural Analysis
The software also includes a ‘workflows’ feature set which allows users to automate these steps – an ideal solution for busy laboratories requiring consistent results (Figure 4).
With the basic workflow in place, users can easily manipulate the workflow to run multiple samples, storing results in a Microsoft Excel-compatible file format. If more than one sample requires analysis, a repeat loop can be inserted to measure multiple samples in a row.
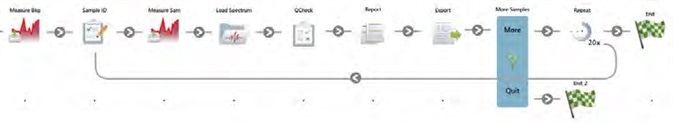
Figure 5. A schematic overview of the final workflow. The workflow, spectra, results, and reports are all automatically saved. Image Credit: Thermo Fisher Scientific – Materials & Structural Analysis
Figure 5 displays an example of this functionality, using a Repeat tile to replicate the workflow a total of 20 times. This workflow collects a single background spectrum to use with all other measurements, therefore saving time.
An Export tile has been appended to the save results to a text file, and it is possible to add an Exit tile to exit the workflow to run fewer than 20 samples.
Simplifying workflow development with OMNIC paradigm software
Users can create workflows by dragging and dropping tiles on the touchscreen, moving these from the left sidebar to the center canvas area. Users can then double-click a tile to edit the parameters and select the Play button to obtain results (Figure 6).
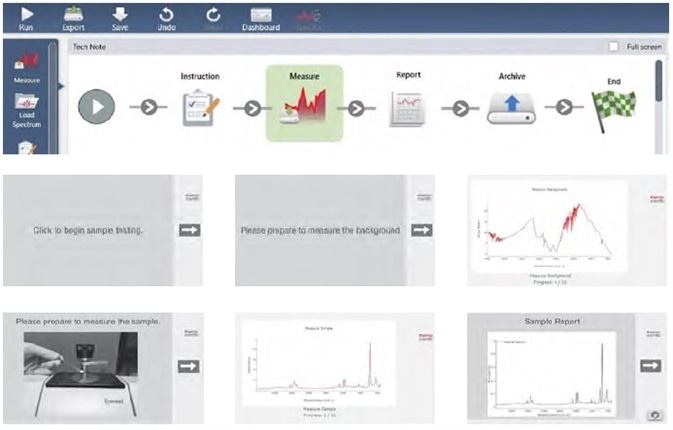
Figure 6. An example OMNIC Paradigm workflow. This sample workflow displays a starting instructional prompt, followed by steps to measure the background, measure the sample, generate the report, and archive the results, with the associated screens that will display. Image Credit: Thermo Fisher Scientific – Materials & Structural Analysis
A total of eighteen tiles are available, and users can customize instructional prompts with text and images. There are ultimately endless streamlining possibilities for any method or SOP.
After collecting a sample, processing a spectrum and establishing a history, users can also select the "Create Workflow" button to generate an automated, customized workflow.
It is possible to display spectra while the instrument is scanning or hide these from the user. Spectra will be automatically archived to a user-selected location.
Conclusions
The OMNIC Paradigm software offers a contemporary FTIR spectroscopy platform that facilitates mathematical comparison between spectra to assess sample purity.
OMNIC Paradigm automates this process further, automatically creating workflows based on spectral processing history, storing this information in a robust database for retrieval or further analysis.
Acknowledgments
Produced from materials originally authored by Steve Lowry and Katherine Paulsen from Thermo Fisher Scientific.
About Thermo Fisher Scientific – Materials & Structural Analysis
 Thermo Fisher Materials and Structural Analysis products give you outstanding capabilities in materials science research and development. Driving innovation and productivity, their portfolio of scientific instruments enable the design, characterization and lab-to-production scale of materials used throughout industry.
Sponsored Content Policy: News-Medical.net publishes articles and related content that may be derived from sources where we have existing commercial relationships, provided such content adds value to the core editorial ethos of News-Medical.Net which is to educate and inform site visitors interested in medical research, science, medical devices and treatments.