Unacceptable toxicity effects lead to a significant number of drugs failing in the later stages of the drug development pipeline, with drug failures in clinical trials partly resulting from the use of insufficient predictive models in drug candidate screening.
Three-dimensional (3D) organoids have the potential to improve predictivity in in vitro assays, highlighting organoids’ value when employed in preclinical testing.
Toxicity to the intestine is one of the most common side effects of anti-cancer drugs, typically limiting the dose that can be administered to treat patients.
The use of 3D organoids in in vitro assays can help assess anti-cancer compounds’ toxic effects, offering vital information during the drug development process.
It is possible to leverage automated high-content imaging to improve throughput and extend the scope of information about toxicity effects, particularly as these relate to sophisticated 3D biology models.
The study presented here demonstrates the evaluation and quantitation of toxic effects in intestinal organoids using high-content imaging.
A method was developed to evaluate the potential toxicity effects of ten compounds on mouse intestinal organoids
The workflow offered a range of benefits, including:
- A novel workflow using healthy intestinal organoids to evaluate compound toxicity effects
- The ability to measure and quantitate phenotypic effects triggered by compounds via high-content imaging
- Assessment of compound toxicity earlier in the drug discovery pipeline
Methods
Organoid culture
Primary mouse intestinal organoids provided by StemCell Technologies were cultured in Matrigel domes using IntestiCult media. This was done in line with the manufacturer’s recommended protocols.
Automated media exchanges and monitoring via transmitted-light imaging were performed every 24 hours during organoid culture. As expected for intestinal organoid phenotypes, organoids self-organized and developed complex crypt structures.
Organoid domes were seeded into 96-well plates (Ibidi plates) with 50% Matrigel domes (15 µL per dome) to perform toxicity evaluation assays. Each dome contained around 60 organoids.
Organoids were manually plated or plated using the CellXpress.ai™ Automated Cell Culture System.
Compounds were added to organoids following 48 hours in culture. Compound treatments were prepared using a seven-point, four-fold serial dilution that started from a 200 µM concentration. Staurosporine, however, started at 20 µM.
Each dilution step reduced this concentration to 25% of the previous level, and controls were also treated with 0.1% DMSO.
Organoids were cultured with compounds for three days. Organoids were stained with Hoechst and MitoTracker Orange following compound treatments. They were then fixed with 4% paraformaldehyde before being stained with Alexa488 Phalloidin in the presence of 0.05% Triton X. All dyes were acquired via Thermo Scientific.
Organoid imaging
The ImageXpress™ HCS.ai High-Content Screening System with confocal option (60 µm pinhole) was used to image the organoids in three fluorescent channels (DAPI, TRITC, and FITC) and at 10X magnification. Following imaging, 3x3 sites per well were acquired at 10X magnification to ensure the entire dome area was covered.
Further images were acquired at 4X magnification. Four tiled images were employed to cover the organoid dome area, while Z-stacks of 16 images were acquired at an 8 µm interval, covering a Z-range of around 120 μm.
Maximum projection two-dimensional (2D) images were employed in the analysis process, while 3D Z-stacks of images were used for volumetric analysis.
Image analysis
The IN Carta® software was used for image analysis. The software’s custom module editor (CME) was employed to generate a multi-step analysis protocol able to define organoids as blobs using the DAPI channel (nuclear stain) in projection images. Analysis was then applied to maximum projection images.
Measurements were taken regarding the number of organoids, average organoid fluorescent intensities, and average organoid area for DAPI (Hoechst stain), FITC (Alexa488 Phalloidin), and TRITC (MitoTracker).
A Gaussian filter was initially used to blur the Hoechst signal to facilitate organoid segmentation. Nuclei were then segmented and used to define cells.
Next, cells were scored as either positive or negative depending on the signal intensities for MitoTracker (mitochondria) or Phalloidin (actin cytoskeleton).
Positive and negative cell scoring thresholds were set empirically using samples treated with toxic compounds (for example, ailuropodine) and control (untreated) samples.
Cells that were scored positive for mitochondria or actin were defined as having intact mitochondria or an intact cytoskeleton, respectively.
Positive and negative cells per organoid were counted, with measurements taken of the average intensity and average area of positive cells. Average organoid volumes were evaluated using 3D CME analysis. This analysis employed a custom module designed to define organoids in 3D as volumetric objects.
Concentration dependencies for different readouts were plotted as a four-parameter curve fit (for the 0.12–200 µM concentration range) after analysis to calculate EC50s for compound toxicity effects. The curve fit and calculation of EC50s were performed using the SoftMax® Pro software.
Results
Ten compounds were tested for toxic effects. Cisapride was used as a negative control, while staurosporine was the positive control.
Compounds were tested in 4X dilutions, with a concentration range of 0–200 µM, in duplicate or triplicate. The toxicity evaluation assay was done in a 96-well plate format.
Organoid cultures were set up using the CellXpress.ai system in this instance, but it is possible to set these up manually. Organoid domes were fixed, stained, and imaged as described after compound treatment for three days, while organoids were imaged using the HCS.ai system.
Figure 1 features maximum projection images of cultured intestinal organoids that have been stained with Hoechst, MitoTracker, and Phalloidin.
Organoids generally vary in size and complexity, but all intact organoids showed strong actin signals indicating the cytoskeleton (in green) and MitoTracker signals indicating intact mitochondria (in orange).
The presence of intestinal crypts was also noted, typical for the intestinal organoid phenotype.
Image analysis was used to ascertain the number of organoids in the dome. It was also used to measure organoid size (area) and fluorescent intensities with different markers, to identify individual cells, and to count damaged or intact cells.
To quantify the intact cells, cells were scored as positive, or intact, if they exhibited a high signal for actin or MitoTracker. Meanwhile, cells with low staining for actin or mitochondria were scored as dead or damaged cells.
Thresholds between positive and negative cells were empirically determined by comparing positive and negative sample wells. The analysis was then applied to the whole plate, including wells that had been treated with different concentrations of compounds.
The 4X magnification was found to be better at capturing phenotypes of entire organoids, while the enhanced nuclear and cellular resolution at 10X magnification was found to better quantitate the percentages and numbers of positive and negative cells for different markers.
Organoid density was key to the accuracy of results: greater density enables improved quantitation statistics, but organoids seeded too densely will overlap in the image and cause inaccurate segmentation (detection) of organoids. These studies found 60.3±18.2 organoids per well.
Organoids that had been treated with compounds exhibited considerable changes in phenotype.
Figure 2 features images of organoids acquired with 10X magnification. The organoid shapes were found to have morphed to more rounded or collapsed phenotypes. It was also noted that increased compound concentrations resulted in reduced MitoTracker or Phalloidin stains.
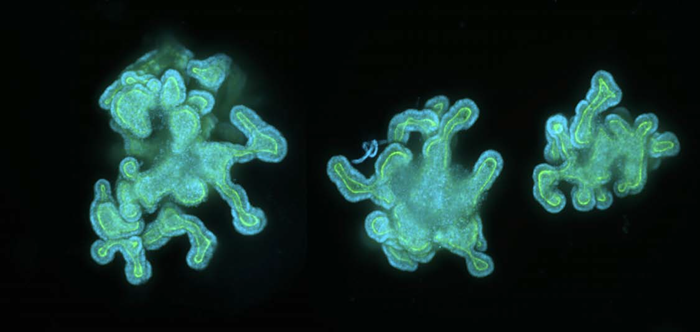
Figure 1. Intestinal organoids (untreated control). Organoids were stained in Matrigel domes with Hoechst nuclear stain and Alexa-488 Phalloidin, as described in the Methods section. Confocal Z-Stacks (16 planes, 8 μm interval) in DAPI, FITC, and TRITC channels were taken with the HCS.ai imaging system at 10X magnification. Maximum projection composite images for intestinal organoids are shown (Hoechst in blue, Phalloidin in green). Image Credit: Molecular Devices UK Ltd
A number of readouts were selected to evaluate phenotypic changes, including:
- The number of cells with intact actin (actin-positive cells) per organoid
- The number of actin-negative cells per organoid (damaged cells)
- The number of cells with intact mitochondria per organoid
- The total area of actin-positive cells
- The average nuclear intensity
- Average volume of organoids
Cell-based analysis and quantitation of cell counts averaged per organoid and per organoid well were the most efficient methods for quantitating toxic effects.
This range of readouts enabled the quantitation of different aspects of toxicity:
- Inhibition of growth/collapsing organoids via volume evaluation
- Disintegration of cytoskeleton/cell death
- Collapsing cytoskeleton by area
- DNA integrity via Hoechst stain
- Mitochondria integrity
A CME rule was generated to locate organoids using Hoechst stain before defining individual cells and scoring these as either positive or negative via actin and mitochondria stains.
Figure 3A features several CME analysis steps that employ nuclear stain (DAPI channel) to define cell nuclei and actin staining (FITC channel) to score cells as either positive or negative.
Figure 3B features analysis masks for both actin-positive and actin-negative cells in organoids.
Image analysis shows obvious differences between treated and untreated samples. It also illustrates concentration-dependent changes in terms of the numbers of intact (live) cells or affected (negative) cells, live cell area, cells with intact mitochondria, and nuclear intensity.
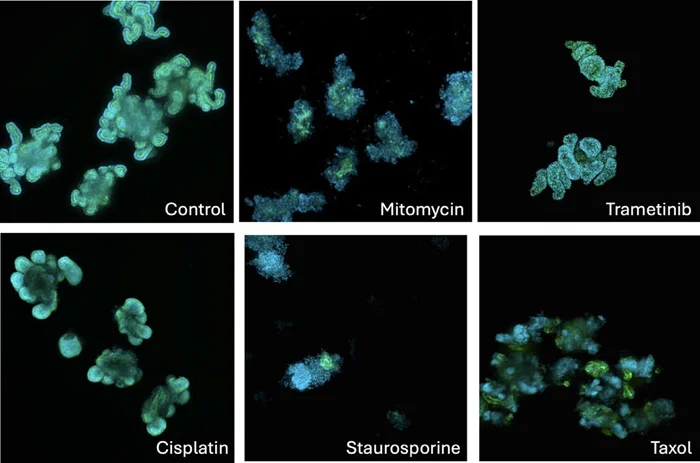
Figure 2. Phenotypic changes caused by selected cytotoxic drugs. Confocal images of organoids treated with selected anti-cancer drugs. Samples in the picture were treated with control (0.1% DMSO), mitomycin (10 μM), trametinib (10 μM), cisplatin (10 μM), staurosporine (1 μM), and Taxol (10 μM), respectively. Confocal images were taken with 10X magnification using a Z-stack of 16 images 8 μm apart. Maximum projection composite images shown. Hoechst – blue, Phalloidin – green. Image Credit: Molecular Devices UK Ltd
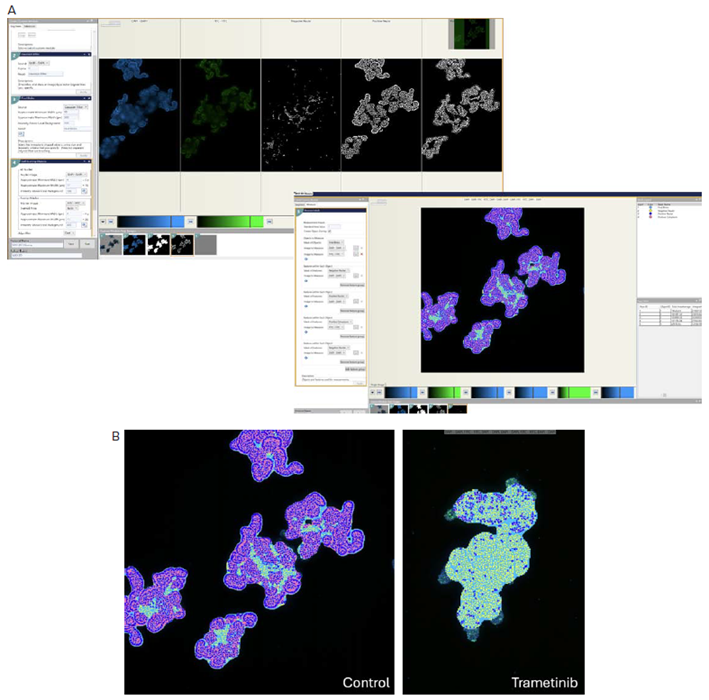
Figure 3. A) CME analysis masks show steps of finding cells with intact cytoskeleton, i.e., positive for actin staining, or damaged cells, i.e., negative (weak) for actin staining. B) Analysis masks are shown for untreated organoids and organoids treated with trametinib. Masks: blue – organoids; yellow – cells with weak actin stain; dark blue – cells with intact actin; pink – cytoplasm of cells with intact actin. Maximum projection images were used for analysis. Image Credit: Molecular Devices UK Ltd
The bar graphs in Figure 4 highlight concentration-dependent changes for a subset of tested compounds. Decreases in the average number of intact cells per organoid (positive for actin stain) and decreases in the number of dead or damaged cells (with decreased actin stain) are also displayed.
Panel A highlights the number of cells with intact cytoskeletons, while Panel B highlights the number of cells per organoid that exhibit decreased actin staining. This phenotype was found to be consistent with dead or damaged cells.
It is important to note the decrease in this number at very high compound concentrations. This indicates that cells appear to have fallen apart and were no longer detected by nuclear stain.
A decrease in nuclear stain was also observed for a number of DNA-intercalating agents, particularly with cytarabine and doxorubicin. Panel C displays a dose-dependent decrease in nuclear intensity. The number of cells per organoid with intact mitochondria was also detected.
There was an observable decrease in mitochondria-positive cells in line with increasing concentrations of drugs. Average organoid volumes were also evaluated by using nuclear staining.
Average volumes decreased with several compounds, indicating that organoid growth could have been inhibited by those compounds.
Numeric data for appropriate readouts was imported into the curve-fit software (SoftMaxPro) following analysis, and effective concentrations for toxicity effects were determined. EC50s are shown in Table 1. It is also important to note that Prism or any other suitable software can be used for EC50 calculations.
It was noted that all tested compounds, other than cisapride, had toxic effects on intestinal organoids. These effects were measured by a number of morphological changes.
Compound effects were most prominent when examining cytoskeletal integrity measured via actin staining. Mitochondria potential decreased in line with increased compound concentrations, but effective concentrations were generally higher than for cytoskeleton integrity. These findings suggest that mitochondrial damage was not a primary mechanism of cytotoxicity.
However, DNA-intercalating compounds mitomycin, cisplatin, doxorubicin, and cytarabine decreased nuclear intensity. This is consistent with those compounds’ expected mechanisms of action.
There was a notable decrease in average organoid volume with the majority of anti-cancer compounds, particularly doxorubicin, mitomycin, staurosporine, cytarabine, and trametinib. This was consistent with inhibition of cell proliferation that appeared to have limited organoid growth.
Observations revealed that actively proliferating, healthy intestinal microtissues were susceptible to the toxic effects of anti-cancer drugs. This means that this approach can be used to evaluate the in vitro side effects of anti-cancer drugs.
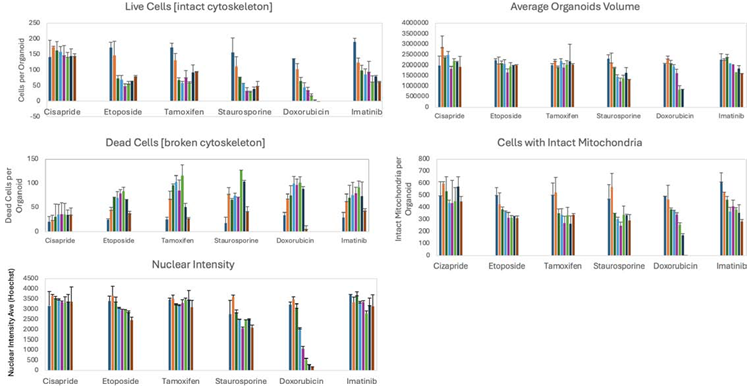
Figure 4. The bar graph shows decreases in the numbers of actin-positive (intact) cells per organoid, averaged per well, and changes in other phenotypic measurements with increased concentrations of tested compounds. The first bar of each series indicates control. Image Credit: Molecular Devices UK Ltd
Table 1 . EC50s for compound effects across different readouts (nd – not determined). Source: Molecular Devices UK Ltd
| EC50, μM |
Positive (intact)
cells |
Nuclear
intensity |
Cytoplasm Area
Sum |
Mitochondria
Integrity |
| Cisapride |
nd |
nd |
nd |
nd |
| Staurosporine |
0.62 |
0.61 |
0.58 |
0.52 |
| Etoposide |
5.5 |
nd |
5.2 |
6.1 |
| Doxorubicin |
5.2 |
10.8 |
5.5 |
Inconclusive |
| Imatinib |
4.8 |
nd |
7.6 |
12.1 |
| Mitomycin |
5.3 |
5.1 |
7.3 |
5.6 |
| Cytarabine |
4.8 |
4.3 |
8.4 |
5.8 |
| Cisplatin |
18.1 |
nd |
22.8 |
30.8 |
| Trametinib |
4.6 |
20.1 |
18.2 |
20.3 |
Discussion
High-content imaging can be used to measure and quantitate various effects of compounds reflecting multiple phenotypic changes, including organoid size, intact or damaged cell counts, marker intensities, nuclear intensity, or mitochondrial signal.
This method is appropriate for the in vitro evaluation of drugs’ toxic effects on healthy intestines.
Various additional markers can be used to address other specific effects on cellular subtypes in organoids, depending on the experimental design. This approach enables the assessment of cell death phenotypes and the impact on nuclei, mitochondria, or cell proliferation.
Both a multi-parametric approach and simultaneous analysis of multiple readouts can be improved by using statistical methods for compound clustering and extending the number of analytical readouts. This approach helps locate similar effects and offers additional insight into the mechanism of action.
Conclusion
A method for compound screening was developed using intestinal organoids in a 96-well plate format by leveraging high-content imaging with the HCS.ai system and the IN Carta image analysis software.
The workflow demonstrates the use of complex organoid models in compound testing and toxicity assessment studies in automated protocols. These were developed combining high-content imaging and process automation.
The methods have shown to be appropriate for toxicity assessment studies, enabling comprehensive evaluation of various phenotypic changes in complex organoids.
Acknowledgments
Produced from materials originally authored by Oksana Sirenko and Krishna Macha from Molecular Devices.
About Molecular Devices UK Ltd
Molecular Devices is one of the world’s leading providers of high-performance bioanalytical measurement systems, software and consumables for life science research, pharmaceutical and biotherapeutic development. Included within a broad product portfolio are platforms for high-throughput screening, genomic and cellular analysis, colony selection and microplate detection. These leading-edge products enable scientists to improve productivity and effectiveness, ultimately accelerating research and the discovery of new therapeutics. Molecular Devices is committed to the continual development of innovative solutions for life science applications. The company is headquartered in Silicon Valley, California, with offices around the globe. For more information, please visit www.moleculardevices.com.
Sponsored Content Policy: News-Medical.net publishes articles and related content that may be derived from sources where we have existing commercial relationships, provided such content adds value to the core editorial ethos of News-Medical.net, which is to educate and inform site visitors interested in medical research, science, medical devices and treatments.