During drug research and development, it is important to measure and characterize binding interactions between low-molecular weight (LMW) ligands and proteins. However, this can present several challenges, the most recognized of which include the need to evaluate a wide range of binding affinities (KD) and the precise ranking and characterization of LMW ligands based on energetics of interaction, affinity and mechanism of action. Factors that can complicate the reliable interpretation of binding data include incorrect assessment of protein concentration and the presence of an inactive protein fraction. In addition, interpretation of this data can also be complicated by uncertainty regarding the concentration of compound stocks, which can arise as a result of limited solubility, incorrect measurement or chemical dissimilarities between compounds.
Isothermal Titration Calorimetry
Isothermal titration calorimetry or ITC is a technique that determines the amount of heat absorbed or released during a binding process. This technique makes it possible to analyze the interactions between proteins and small molecules in a solution, without immobilization or labeling being required. Well-designed experimental conditions and the use of a highly-sensitive ITC instrument make it possible to account for an inactive protein fraction or an incorrectly assessed protein concentration, as well as an inaccurate concentration of compound solutions. The ITC technique improves understanding of biochemical data and is used throughout the initial phase of drug discovery, from assay optimization work and secondary screening through to the later phases that involve lead optimization. This technique is also employed in the protein purification quality control step to evaluate freeze-thaw stability and batch-to-batch variation.
This article describes the benefits of using the new ITC instruments MicroCal PEAQ-ITC analysis software and the MicroCal PEAQ-ITC and MicroCal PEAQ-ITC automated systems. The software allows assessment of binding interactions that are complicated by inaccurate protein concentration, an inactive protein fraction and/or inaccurate concentration or heterogeneity of compound solutions.
Determination of Active Protein Concentration
The periodic use of a positive control ligand provides a way of monitoring protein quality and a means of confirming the concentration of active proteins throughout a series of ITC experiments. Scatter plots of binding parameters are generated by the MicroCal PEAQ-ITC software across a series of consecutive ITC titrations. These plots help detect potential trends and issues relating to reagent quality and assay setup.
Figure 1 shows a scatter plot of N values obtained across consecutive ITC titrations. The gradual decrease in N value possibly reflects stability problems associated with the target protein. Some common challenges that arise during analysis of protein-ligand interactions are batch-to-batch variations, limited freeze-thaw stability of a target protein and limited protein stability. ITC data is useful for determining whether one protein lot varies in its apparent activity (binding) when compared with previous lots and for providing potential normalization criteria that could be used in a number of assays run during the characterization/screening process.
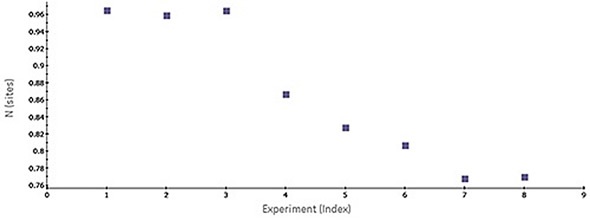
Figure 1. Scatter plot of N-values generated by MicroCal PEAQ-ITC software for a series of consecutive titrations of 5 µM bovine carbonic anhydrase II (bCAII) with 50 µM ethoxzolamide in phosphate-buffered saline (PBS), 25°C. The experiments were conducted in the MicroCal ITC automated system (at a time interval of 1.5 h between experiments).
Once the active protein concentration is ascertained and used in the ITC data analysis, any remaining errors identified in the apparent stoichiometry can be assigned to inaccurate determination of ligand concentration.
Accurate Determination of Ligand Concentration
In drug discovery, significant errors commonly occur in the given concentration of compound solutions, which directly impacts on the quality of the binding parameters returned by the fitting binding data, particularly in the accurate determination of the entropic and enthalpic contributions to binding.
Using the MicroCal PEAQ-ITC Analysis Software, the compound concentration error can be detected and accounted for, thereby minimizing any errors in the thermodynamic measurements.
Figure 2 shows the scatter in the stoichiometry (N) ascertained through ITC for an interaction of a target protein with a series of LMW hits in a drug discovery and development project performed using the MicroCal Auto iTC200 instrument. The N values, which varied between 0.2 and 1.8, were not correlated with an inactive protein fraction, which was already established using the above-mentioned method. A 1:1 binding stoichiometry was predicted for the compounds based on X-ray structures of the complexes. It was therefore clear that the variations in apparent stoichiometry arose as a result of the ligand concentrations being incorrectly determined.
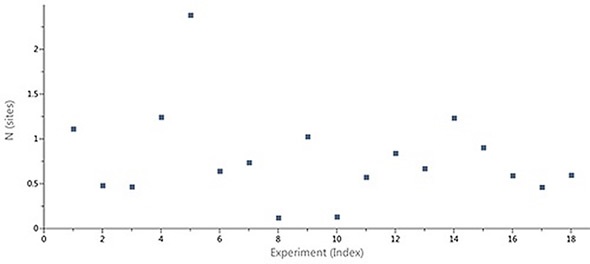
Figure 2. Case study (client-provided data). Summary of N values obtained for interactions of a target protein with a series of LMW hits in a drug discovery and development project conducted on MicroCal Auto iTC200.
Such errors directly affect the enthalpy information produced by the ITC instrument, which makes it challenging to interpret the variations in the thermodynamics of the interaction of each ligand to the target protein. Such errors can be accounted for using the MicroCal PEAQ-ITC Analysis Software, which enables the LMW ligand concentration in the syringe to vary, whilst setting the stoichiometry value to 1 during the fitting process. The enthalpy data that is returned with and without this correction factor is shown in Figure 3.
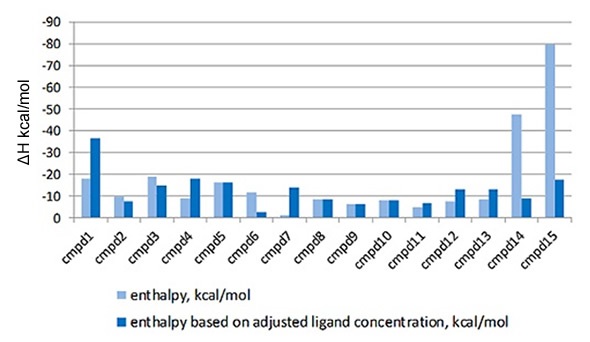
Figure 3. Comparison of the enthalpy data returned for the interaction of a series of LMW hits with a target protein in a drug discovery program, with (light blue) and without (dark blue) the correction for ligand concentration. The compounds are listed in order of descending affinity
It is clear that when the errors in ligand concentration are accounted for in the analysis, the enthalpy data returned is significantly different, which will clearly impact on how the structure activity relationships (SAR) of this lead optimization analysis is interpreted. Also, incorrect ligand concentrations can lead to experiments being difficult to analyze due to the incomplete nature of the binding isotherm, meaning the experiments may need repeating. Figure 4 demonstrates an example of this.
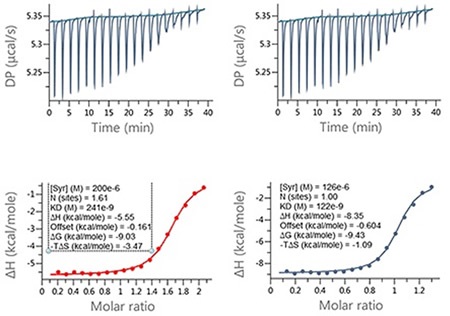
Figure 4. Examples of ITC data for the titration of a LMW ligand into a protein where the ligand concentration was in significant error. Raw ITC data (upper panels) and integrated data fitted to One-set-of-sites interaction model (lower panels). The fit was conducted (A) without and (B) with accounting for error in compound concentration. The insets in the lower panel contain the fitted parameters returned by the analysis software.
Simultaneous Affinity Determination for Isomers and Enantiomers
During last-phase drug discovery, many compounds are produced as mixtures of isomers or enantiomers. Often, it is possible to separate the compound mixture using high-performance liquid chromatography (HPLC) so that one or more isomers can be tested separately. However, sometimes and particularly when there is a mixture of enantiomers, the separation process can be challenging and time consuming and these mixtures require direct testing. In contrast to biochemical assays, which mainly provide data on the tightest binding component in a mixture, ITC can provide binding data about both the strong and weaker binders in a single experiment.
Figure 5 shows the biphasic binding isotherm, demonstrating how the ITC information may appear when the enantiomeric ligand mixture is injected into a target protein in the cell. Likewise, biphasic isotherms can be seen when high affinity ligands are deliberately combined with weaker ligands to ascertain KDs beyond the range of direct measurements. Although this approach differs considerably from the standard method, where the tight binding ligand is injected into a mixture of the weak inhibitor and the target, it can enable both inhibitors to be resolved at the same time, without any previous knowledge being needed of the interaction parameters of the weak interaction.
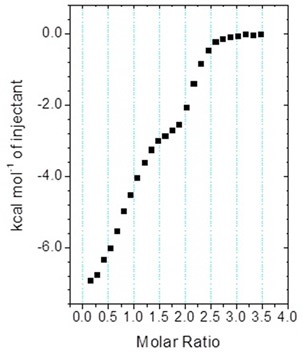
Figure 5. MicroCal iTC200 data for the titration of enantiomeric compound into target protein (client-provided data). The binding isotherm is clearly biphasic; however, analysis of the data with Origin ITC data analysis was not straightforward.
In order to show the utility of the MicroCal PEAQ-ITC Analysis Software for studying complex binding isotherms, a series of experiments were carried out with mixed ligands (furosemide [FUR] and ethoxzolamide [EZA]) injected into a target protein in the cell. Figure 6 shows the data results.
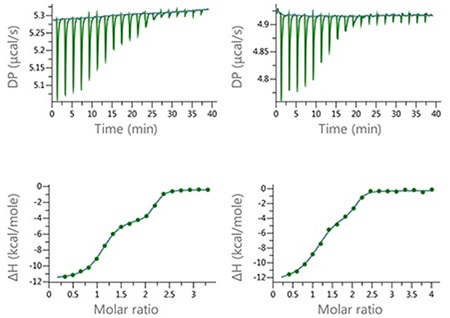
Figure 6. Raw and normalized heat plots for the titrations of the 1:1 mixture of EZA and FUR into bCAII. The titrations were carried out at 160 µM total concentration of the compounds in the syringe and 10 µM concentration of bCAII in the cell (left) or at 100 µM concentration of the compound mixture and 5 µM concentration of bCAII in the cell (right). 18 × 2 µl injection were made and the buffer was PBS, 2 v/v % DMSO at 25°C.
These series of experiments show the level of resolution that can be achieved using the new MicroCal PEAQ-ITC Analysis Software, as well as the potential for quantitative characterization of the binding of mixtures. Table 1 summarizes the thermodynamic parameters achieved using this method with the ‘ligand in cell’ setting and ‘two-sites’ model.
Table 1. Results of the analysis of the data collected for titrations of the 1:1 mixtures of EZA and FUR inhibitors into bCAII with a new MicroCal PEAQ-ITC Analysis Software.
|
bCAII in cell, mM
|
N1 (sites)
|
KD1 (nM)
|
DH1 (kcal/ mol)
|
N2 (sites)
|
KD2 (nM)
|
DH1 (kcal/ mol)
|
|
5
|
0.5 (4)
|
0.8 (100)
|
-15.1 (1)
|
0.6 (7)
|
700 (43)
|
-7 (13)
|
|
10
|
0.49 (3)
|
1 (93)
|
-15.2 (2)
|
0.56 (3)
|
630 (42)
|
-7.1 (5)
|
Conclusion
The MicroCal PEAQ-ITC analysis software has enhanced signal stability, mixing and signal-to-noise characteristics as well as data analysis software that is well suited for use in biophysical laboratories that conduct small-molecule drug research. Since this analytical approach is fully automated, user subjectivity in assessing data quality and the analysis process is minimized. In addition, data quality assessment and fitting can be performed quickly, allowing large data sets of 50 or more experiments to be performed within a matter of seconds.
When proper controls are used, the MicroCal PEAQ-ITC Analysis Software package allows for determination of the ligand concentration or the active target protein concentration, or both. Moreover, the ITC data analysis software includes tools that simplify the fitting of complex binding isotherms that may be seen when titrating with mixtures of enantiomers, some competition experiments or with targets that have more than one binding site. These benefits underscore the value of the additional features integrated within the MicroCal PEAQ-ITC analysis software and the advantages the system provides for powerful data interpretation.
About Malvern Panalytical

Malvern Panalytical provides the materials and biophysical characterization technology and expertise that enable scientists and engineers to understand and control the properties of dispersed systems.
These systems range from proteins and polymers in solution, particle and nanoparticle suspensions and emulsions, through to sprays and aerosols, industrial bulk powders and high concentration slurries.
Used at all stages of research, development and manufacturing, Malvern Panalytical’s materials characterization instruments provide critical information that helps accelerate research and product development, enhance and maintain product quality and optimize process efficiency.
Sponsored Content Policy: News-Medical.net publishes articles and related content that may be derived from sources where we have existing commercial relationships, provided such content adds value to the core editorial ethos of News-Medical.Net which is to educate and inform site visitors interested in medical research, science, medical devices and treatments.