One of the major advantages of differential scanning calorimetry (DSC) is that it depends on heat measurements, which make characterization of native biomolecules possible. It is not necessary to have optically clear samples owing to the absence of spectroscopic readings. In addition, it has to be noted that the characterization not only provides the melting temperature (Tm), but also provides information about forces involved in folding and unfolding mechanisms of biomolecules.
DSC can also be used to measure the extent to which the stability and thermodynamics are affected by the simple effects associated with variations in protonation of macromolecules. This technique can be extended to involve any non-covalently bound ligands, offering an effective screening tool for binding. Further, this technique can also be used to determine binding constants under favorable conditions.
This article discusses the thermodynamic background to DSC measurements and the use of DSC in investigating stability of proteins themselves and of those interacting with ligands. The techniques can, however, be applied on other biological macromolecules, including lipids and nucleic acids.
Basic Equilibrium Thermodynamics
Proteins are transferred between a structured, native and biologically active conformation (N) and an unstructured, denatured and inactive conformation (D) with increase in temperature beyond a physiologically significant range. Generally, proteins share these characteristics with organic polymers and a number of biological macromolecules (DNA, lipids, etc.). The following sigmoidal trace (Figure 1) can be observed in signals from a protein that undergoes this conformational transition.
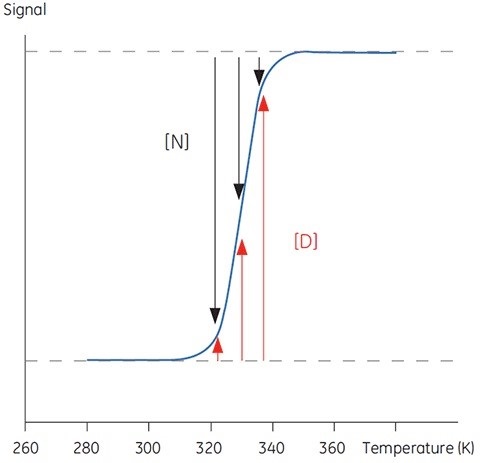
Figure 1. Typical sigmoidal transition for the denaturation of a 100 amino acid protein. Below 300K, the protein is essentially native, above 340K the protein is denatured. Between these temperatures, the relative occupancy of each state is indicated by the length of the black and red arrows respectively
The covalent behavior of the molecule remains unchanged when the protein structure is melted in this manner. Only the non-covalent interactions are disturbed. Mostly, these interactions will come into play spontaneously when cooling down the protein, thereby providing the active native conformation. Therefore, N is in reversible equilibrium with D as an intensive variable with temperature:

The proportions of N and D in Figure 1 vary when the equilibrium is in the direction of D with increasing temperature. It is possible to define an equilibrium position at any one temperature, yielding the equilibrium constant (Keq) that only expresses the relative concentrations of N and D.
This equilibrium constant can be related to the Gibbs free energy (ΔG) in a logarithmic scale, as expressed below:

Where, R = gas constant and T = temperature in Kelvin.
The midpoint of transition or melting temperature Tm is nothing but the temperature at which N and D have equal concentrations. At this temperature, Keq is equal to 1, and ΔG is 0.
Since the temperature-dependent interactions stabilize the native structures of the proteins, these biological macromolecules exhibit this kind of melting behavior.
Enthalpy (ΔH) stabilization demands interactions associated with bond making, structuring, and reduction in internal energy. Conversely, the entropy (ΔS) stabilization represents disordering interactions, allowing the system to be organized in more number of ways with the same energy. These terms can be expressed in terms of ΔG as follows:

Given below is the van’t Hoff Equation obtained by combining and rearranging Equations 3 and 4. Based on Equation 5, it is possible to plot the differences in equilibrium constant against temperature to obtain the entropy and enthalpy of the thermal denaturation:

The equilibrium constant can be determined at temperatures in the transition region from the data in Figure 1. Thus, the enthalpy derived in this manner is known as the van't Hoff enthalpy, which is based on the DSC trace shape. Hence, it is not a direct function of the heat of reaction.
Direct Measurement of Thermodynamics Using Calorimetry
The enthalpy for denaturation of a protein can be directly measured using calorimetry. Ultra-sensitive calorimeters, including MicroCal™ VP-Capillary DSC, are ideal for accurate measurement of enthalpies from fractions of mg of a material. The operation of these systems is based on the measurement of the heat capacity (Cp) of a protein sample solution while scanning up or down in temperature. The relationship of Cp with the enthalpy is expressed by Kirchoff’s law:
At the time of scanning, the measurement of excess (differential) heat capacity of the protein is carried out with respect to a carefully matched solvent reference cell. Hence, these kind of instruments are termed as differential scanning calorimeters.
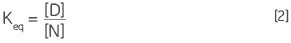
A DSC measurement is similar to Figure 1, with an exception of heat capacity as the property of the protein followed during the denaturation. This results in a conformational transition such as the one shown in Figure 2. It is evident from Equation 6 that the excess heat capacity function needs to be integrated to achieve the enthalpy. MicroCal VP-Capillary DSC is a versatile tool ideal for measuring minute changes in heat capacity during protein denaturation in a dilute solution.
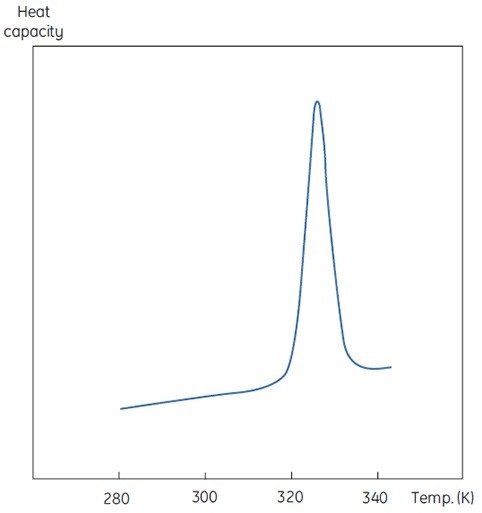
Figure 2. DSC data for the denaturation of the 118 amino acid protein barnase measured at 20μM (0.25mg/ml) at 60K/h in MicroCal VP-Capillary DSC. The instrumental baseline recorded with buffer is indicated in red (top panel). The lower panel shows the data after buffer subtraction.
Two-State and Non Two-State Equilibria
The analysis of data in Figure 2 can be performed in a manner similar to that of any other property of the protein, which undergoes a transition on denaturation as stated above. This results in the Tm and the model-dependant van’t Hoff enthalpy, now ΔHvH, to differentiate it from ΔHcal. The comparative study of these two enthalpy measurements obtained in the same experiment results in a robust test for the protein denaturation model.
Under alternate circumstances, ΔHvH is smaller than ΔHcal, which suggests lower average molecular weight of the equilibrium species when compared to that of the protein. Therefore, a denaturation scheme that involves intermediates (I) may be more appropriate:

It also possible to have ΔHvH larger than ΔHcal, which represents that the species in equilibrium will have a larger molecular weight or size when compared to that of the protein. In such cases, proteins tend to produce dimers, tetramers, or higher order aggregates in the ratio of ΔHvH to ΔHcal:

This is a two-state equilibrium as only N and D are involved. Any variation in the ratio of ΔHvH to ΔHcal denotes that the dependence of the concentration per mol term in the calculation is on the subunit instead of the oligomeric protein.
Irreversible and Non-equilibrium Denaturation
A simple and potentially useful experiment is carried out in order to rescan the same sample subsequent to the completion of a DSC measurement. The interaction is said to be fully repeatable with the native and denatured states in equilibrium when an identical endotherm is identified during rescan. However, in large number of cases, no transition or one of reduced magnitude on protein rescanning can be observed. This proves the presence of an irreversible step in the denaturation mechanism:

The unimolecular (U) scheme processes, including deamidation, proline isomerization and so on, can result in irreversible modification and prevention of refolding. The irreversible step can also be a result of association or aggregation (Ag) of the denatured state:

The concentration of D will be increased at higher sample concentrations such that the irreversible step is sped up, resulting in a lower Tm for the protein. Under the circumstance of significant and rapid aggregation, the denaturation transition can be distorted and truncated with the exothermic aggregation event. The atypically noisy data observed above the transition region is shown in Figure 3.
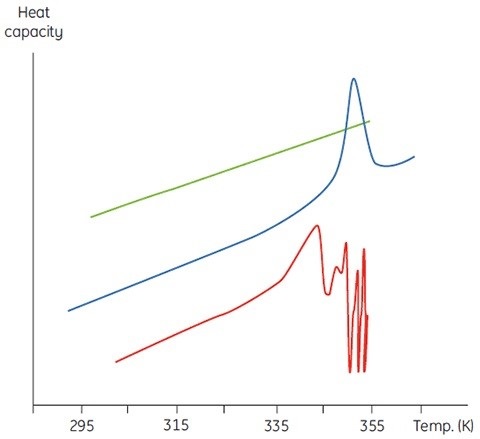
Figure 3. Raw DSC data for the denaturation of an aggregating protein (red). Data for the buffer baseline (green) and the same protein (blue) under different conditions where aggregation is almost completely eliminated are shown for comparison.
In this aspect, calorimetry is not an exceptional method. DSC is the method that often faces aggregation issues, which cannot be observed in spectroscopic thermal denaturation experiments performed at similar sample concentrations. However, under both circumstances, it is better to investigate the scan rate and sample concentration dependence of the DSC measurements.
Thermal Stability; Interpreting the Tm
In addition to the comparative use of the enthalpies, DSC can also accurately determine the enthalpy itself and a Tm value. The Tm is a reflection of protein’s thermal stability, and it should not be directly related with stability in terms of longevity of activity in the sample or its shelf life as an irreversible step can introduce an additional kinetic dimension. Theoretically, the protein in the simplest equilibrium (Equation 1) with perfect reversibility, has an infinite shelf life. At a temperature over the Tm, the rate of non-equilibrium step in the simplest case of irreversible denaturation (Equation 9) will determine the extent until which the protein can retain the act of populating the active native state.
It is not appropriate to equate thermal stability with the equilibrium stability of a protein at temperature beyond its Tm. Extrapolation of the equilibrium constant, and thus ΔG beyond the Tm, is a difficult task, which is based on a number of parameters.
Thermal Stability; Interpreting the Thermodynamics
As Tm is the midpoint of enthalpy determination, the enthalpies determined in the DSC experiment can be applied to the Tm of measurement. ΔG is 0 at this temperature, and ΔS is designated as ΔH/Tm from Equation 4. It can also be said that ΔS is achieved through elimination, and not by measurement. The errors resulted from the ΔH and Tm determination can distribute into ΔS.
It could be said that these fundamental thermodynamic quantities would provide an insight into the forces stabilizing protein structures. In general, there are a less number of chemical groups in a protein polypeptide that are capable of interacting; groups from the backbone carboxyl and amide and from the amino acid side chains. These groups are linked with each other via an equally small set of interactions: hydrophobic effects, electrostatic charge-charge attractions, hydrogen bonding and Van der Waals forces. These interactions, by their non-covalent nature, operate at equilibrium between two extremes, both interacting and non-interacting. Hence, they can be defined based on the thermodynamics explained above. Thus, information can be obtained about the nature and strength of these interactions from the ΔH and ΔS determined for the protein denaturation.
Extrapolation and Comparisons of Stability
These parameters are of great use despite their inability to analyze the values of ΔH and ΔS in isolation. They are usually determined at Tm at which ΔG is 0. Hence, ΔG could be determined at all other temperatures to examine the temperature dependence of these parameters. In order to perform this, it is necessary to know the difference in heat capacity (ΔCp) for denaturation of the protein.
Similarly, the change in ΔH and ΔS with respect to the temperature is another way of expressing the Kirchoff relation:
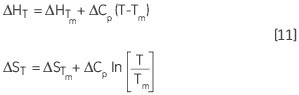
Leading to a temperature dependence of ΔG estimated in accordance with:
Another way of determining ΔCp is evident from Equation 11. The variation of ΔH, δΔH/δT will yield ΔCp, while measuring ΔH for a protein under varying stability conditions. ΔG, ΔH and ΔS can be determined at any other desired temperature using Equation 12. The error resulting from these estimates will reflect the initial error in the measured Tm and ΔH and the length of temperature extrapolation beyond the Tm. It is pointless to compare the experimentally determined ΔH of denaturation for two proteins as they are determined at their respective Tm values. This requires extrapolation of the ΔH data to a common temperature with the help of the ΔCp of each protein. This temperature is ideally the mid-point between the two Tm values ((T1m+ T2m)/2) to reduce the extrapolation errors.
Measuring Protonation Changes
The complexity and information content of thermodynamic data was found to be problematic so far. However, there are methods of exploiting this to provide DSC valuable uses. For instance, during denaturation, the amino acid side chains in proteins with protonatable groups may undergo a shift in pKa. Their interaction is with other charged groups in the native state, and also with the solvent in the denatured molecule.
Upon measuring ΔH for protein denaturation in different buffers at the same level of pH, different values can be observed, which represent the sum of ΔH for the protein event and ΔH for the buffer ionization. A linear function with slope representing the number of protons (sum of all pKa shifts) associated with the denaturation of the protein can be obtained upon plotting the observed values against the ΔH of ionization for the buffers.
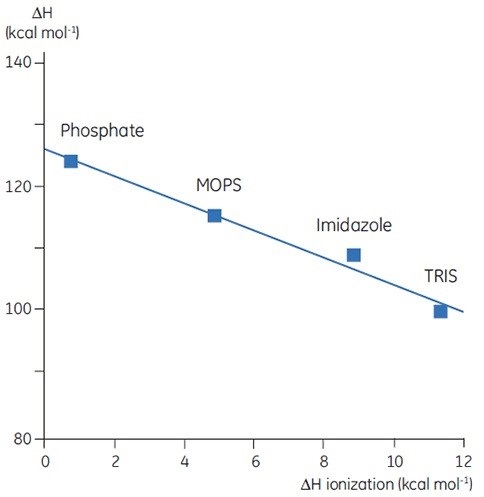
Figure 4. ΔH of denaturation of a 150 amino acid protein at pH 7.5 vs ΔH of buffer ionization. ΔH ionization is for the process HA -> H+ + A-. The negative slope (-2) indicates 2 protons are released by the protein upon denaturation at this pH.
The selection of buffer is critical while designing DSC experiments. A buffer with a small or zero enthalpy of ionization is recommended for routine work as it avoids any ionization effects on the measurement.
Variation of Thermal Stability with pH
Another result of a protein with protonatable groups having a different pKa in the native and denatured state, the Keq, and hence, ΔG of the protein, will depend on proton concentration of the solution, which is nothing but the pH. This is a sequel of the law of mass action or Le Chatelier’s principle. The solution pH will tend to affect protein’s Keq if it is affected by the denaturation Keq through the release or uptake of protons. This effect can be quantified in:
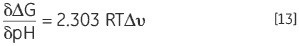
where Δv is the change in protonation. The change in stability for each pH unit is increased with the increasing difference in protonation upon denaturation.
At any desired pH, the thermal stability of a protein can be determined using DSC. ΔG can be calculated using the Tm and ΔH at a common temperature of comparison. Equation 13 can be used to analyze the pH stability profile to achieve protonation change of denaturation at any pH. The corresponding groups, which contribute to the protonation behavior, can be indicated by the impact of specific mutation of charged residues in the protein on these profiles.
Detection and Quantification of Ligand Binding Using DSC
It is appropriate to consider that proteins are simple, non-covalently attached ligands with varying ‘affinities’ (pKa) for the native and denatured states. In this aspect, the effects of mass action must be applied for any ligand with different binding affinity to the native and denatured states. Most or all biologically relevant ligands tend to attach tightly and specifically to the native states of their cognate proteins, without having any affinity for the respective denatured states. Hence, they deliver ligand into solution upon denaturation, thereby affecting the concentration. The mass action effect implies that the native to denatured equilibrium i.e. stability of the protein is affected by the change in the ligand concentration in the solution.
This approach can be exploited in two ways. Firstly, in the form of a stability of the protein bound ligands. Secondly, to measure thermal stability with respect to increasing ligand concentration, which is a more quantitative use of this method. Figure 5 provides the data, which can be used to calculate the binding constant between the ligand and protein.
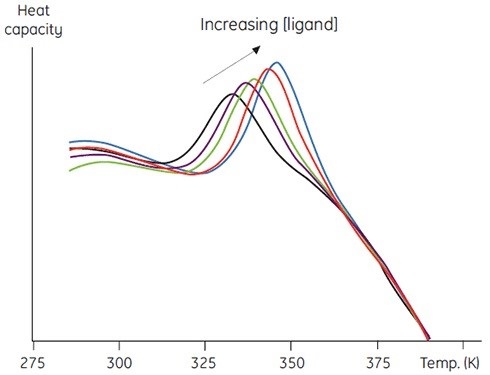
Figure 5. Raw DSC data for the denaturation of a 60 amino acid protein in the presence of its cognate peptide ligand. The protein concentration was 200μM (1mg/ml) and the ligand concentration increased from 0 to 250μM.
The approach has numerous benefits over other traditional methods. It can be used to estimate very tight binding constants, which is not possible through any conventional equilibrium method.
Conclusion
Recent developments in DSC instrumentation and automation have resulted in the fabrication of MicroCal VP-Capillary DSC, which is an automated high-throughput DSC. With the help of automatic robotic sample loading, these devices perform scanning at a rapid rate, thereby providing measurements more rapidly. Before applying higher scan rates, it is advisable to check whether the system is at equilibrium by ensuring the dependence of enthalpies and Tm on this parameter. Upon achieving this, the system can obtain a maximum of 25 scans or so within 24h, and the samples can be loaded on to the system.
The automated DSC approach is a promising analytical technique used for evaluating the stability of proteins as well as other biomolecules. It can also analyze the solution conditions, such as ionic strength, pH and additives, which influence the thermal stability of proteins. The data thus obtained can reflect the optimal conditions for crystalization trials or shelf-life analyses. In addition, this technique provides in-depth evaluation and characterization of the protein-bound ligands with improved thermal stability once they are spotted in a higher throughput primary screen.
Acknowledgements
Produced from content authored by Dr Chris M. Johnsson, MRC Centre for Protein Engineering, Hill Road, Cambridge, UK, CB2 2QH. Email: [email protected]
References
- Neet, K.E. and Timm, D.E. Conformational stability of dimeric proteins: Quantitative studies by equilibrium denaturation. Prot. Sci. 3, 2167-2174 (1994).
- Johnson, C.R. et al. Thermodynamic analysis of the structural stability of the tetrameric oligomerization domain of p53 tumour suppressor. Biochemistry 34, 5309-5316 (1995).
- Freire, E. et al. Calorimetrically determined dynamics of complex unfolding transitions in proteins. Ann. Rev. Biophys. Chem. 19, 159-188 (1990).
- Lepock, J.R., et al. Influence of transition rates and scan rate on kinetic simulations of differential scanning calorimetry profiles of reversible and irreversible protein denaturation. Biochemistry 31, 12706-12712 (1992).
- Myers, J.K. et al. Denaturant m values and heat capacity changes: relation to changes in accessible surface areas of protein unfolding. Prot. Sci. 10, 2138-2148 (1995)
- Connelly, P.R. et al. Enthalpy of hydrogen bond formation in a protein ligand binding reaction. Proc. Natl. Acad. Sci. USA, 91, 1964-1968 (1994).
- Brandts, J.F. and Lin, L.N. Study of strong to ultratight protein interactions using differential scanning calorimetry. Biochemistry 29, 6927-6940 (1990).
- Plotnikov, V.V. et al. An autosampling differential scanning calorimeter instrument for studying molecular interactions. Assay Drug Dev. Technol. 1, 83-90 (2002).
About Malvern Panalytical

Malvern Panalytical provides the materials and biophysical characterization technology and expertise that enable scientists and engineers to understand and control the properties of dispersed systems.
These systems range from proteins and polymers in solution, particle and nanoparticle suspensions and emulsions, through to sprays and aerosols, industrial bulk powders and high concentration slurries.
Used at all stages of research, development and manufacturing, Malvern Panalytical’s materials characterization instruments provide critical information that helps accelerate research and product development, enhance and maintain product quality and optimize process efficiency.
Sponsored Content Policy: News-Medical.net publishes articles and related content that may be derived from sources where we have existing commercial relationships, provided such content adds value to the core editorial ethos of News-Medical.Net which is to educate and inform site visitors interested in medical research, science, medical devices and treatments.