The 1 kDa to 2 MDa range of biotinylated biomolecules can be captured with Gator® SA XT probes. The unique chemical and optical characteristics make three to five times the signal of conventional BLI streptavidin probes possible.
This allows it to load ligands and analytes at lower concentrations, protecting priceless samples. Furthermore, when loaded with bigger biomolecules, its special optical features avoid the signal inversion seen with conventional BLI.
Immobilized biotinylated ligand binds to the target analyte, changing the interference pattern of light reflected off the probe surface. The Gator® instrument tracks these binding events in real-time, and the Gator® GatorOne software is used for analysis.
Product information
Materials required
- Plate Gator Max, PN: 130062
- Gator 96-Flat Plate, Part Number: 130260
- User-supplied precision pipettes
- User-supplied, sterile pipette tips
Storage conditions
Ensure the zipper is completely closed before storing the tray at room temperature (RT) in its foil packaging pouch. Probes remain constant at RT for one year.
General methods
Sample volume
- Maximum Plate: 250–280 µL/well
- 96-well Black Plate: 180 µL - 200 µL/well
- 384-well Black Plate: 80 µL - 100 µL/well
Prewet conditions
Maximum capacity: 250 µL/well Plate in buffer diluent for 10 minutes at 1000 rpm.
Signal comparison with traditional BLI for a peptide
When biotinylated TnI aa 23–40 is loaded, followed by anti-TnI at varying doses, the signal with SA XT is 3–5 times higher than with conventional BLI probes.
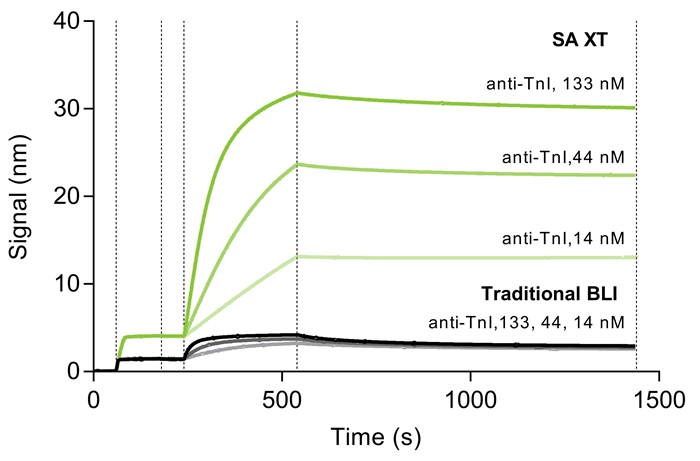
Fig. 1. The graph shows a kinetic experiment between biotinylated TnI peptide (aa 23-40) and anti-TnI antibody. Following a baseline measurement in K Buffer, biotinylated TnI peptide (1 µg/mL in K Buffer) was loaded onto SA XT probes (1000 rpm; 120 sec) followed by association and dissociation of anti-TnI over 133, 44, and 14 nM. Image Credit: Gator Bio
Loading signal comparison with traditional BLI
With biomolecules of various sizes, SA XT has a loading signal that is 3–5 times stronger, enabling loading at lower concentrations.
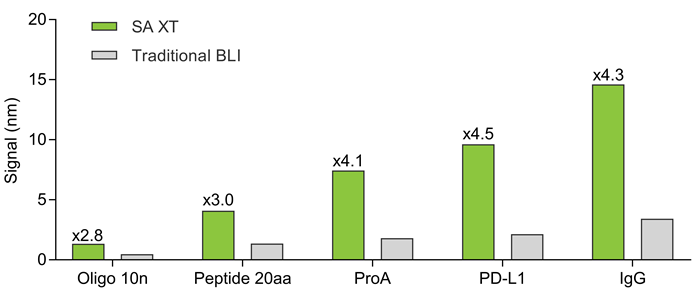
Fig. 2. SA XT generates 3-5 X signal for biotinylated molecules like oligo, peptide, Pro A, PD-L1, and IgG. Image Credit: Gator Bio
Kinetic analysis
Accurate KD values can be obtained for the kinetic study of different peptides and proteins using SA XT. With an R2 of 0.99, the data below exhibits excellent fitting.
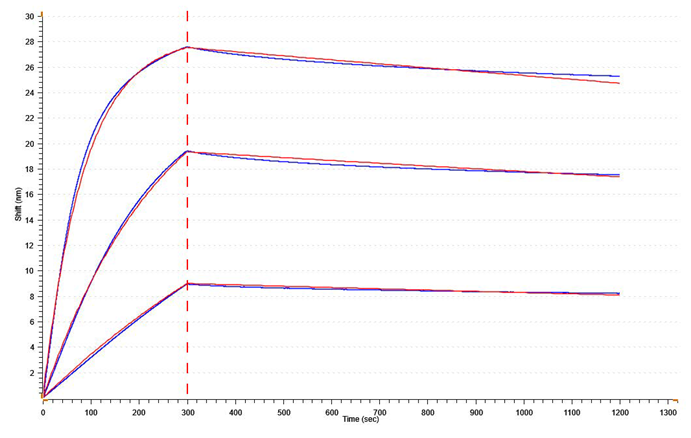
Fig. 3. Global-fit analysis using Gator® GatorOne software for antibody-antigen interaction between TnI aa23-40 and anti-TnI. KD = 0.72 nM (R2 = 0.99) Model: 1:1 Global Rmax Linked. Image Credit: Gator Bio
SA XT and traditional BLI comparison for the analysis of lipid nanoparticles
With SA XT, bilayers nearly 0.7 µm thick can be loaded without the signal inversion seen with conventional BLI. This feature allows for the accurate analysis of larger biomolecules being extensively investigated for drug delivery, such as lipid nanoparticles and exosomes.
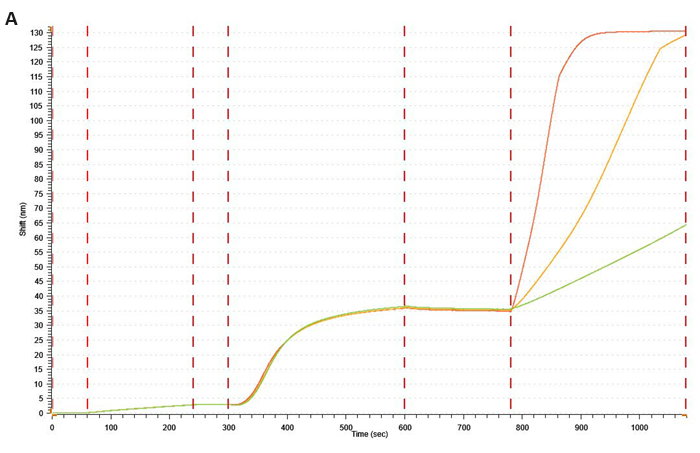
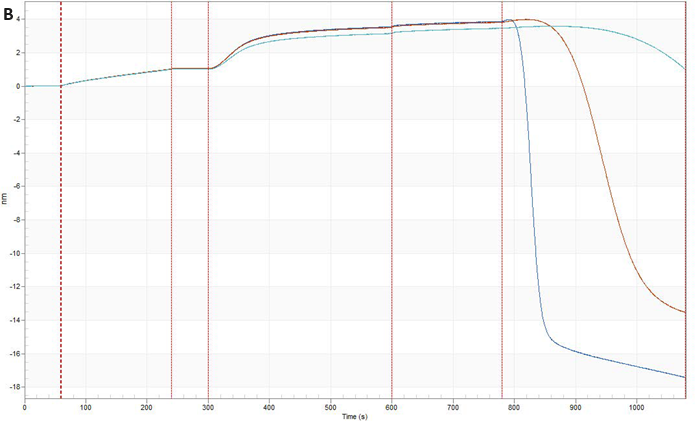
Fig. 4. Graphs show a kinetic experiment between a lipid nanoparticle (LNP) with a diameter of 100 nm and an antiLNP antibody. Following a baseline measurement in K Buffer, biotinylated antibody against a moiety on the LNP surface was loaded onto (A) SA XT and (B) traditional BLI streptavidin probe. Following another baseline in K buffer, the LNP was loaded (1000 rpm; 300 sec). This was followed by association and dissociation of an antibody against the LNP. Image Credit: Gator Bio
Source: Gator Bio, Inc.
| |
|
|
 |
 |
 |
| Streptavidin (SA) Probes |
Streptavidin (SA) Probes |
Flex SA Probes |
 |
 |
| Flex SA Probes |
SA XT Probes |
 |
 |
| Small Molecule Analysis Probes (SMAP) |
Small Molecule Analysis Probes (SMAP) |