This article is based on a poster originally authored by Felix L-Perusse, Josiane Bourque, Martin Cottet, Simon Mathien, and David W. Andrews, which was presented at ELRIG Drug Discovery 2024 in affiliation with Saguaro Biosciences, Institute for Research in Immunology and Cancer and Sunnybrook Research Institute.
This poster is being hosted on this website in its raw form, without modifications. It has not undergone peer review but has been reviewed to meet AZoNetwork's editorial quality standards. The information contained is for informational purposes only and should not be considered validated by independent peer assessment.

Overview
- Cell painting is the main image-based profiling method, which was shown to boost hit rates and compound diversity in pharma-scale drug discovery screens and to provide new insights in SAR.1
- ChromaLIVE, a novel data-rich, non-toxic dye, surprisingly allows for similar performance to fixed cell painting but in live cells, providing new mechanistic insight into treatment.2
- Live cell painting provides several advantages that complement fixed-cell assays2
- Reveals new information on cellular response at different times3
- Obviates washing + fixation, and avoids cell damage and loss
- Quantify intermediate phenotypes
- Biological inertness, allowing higher-fidelity cellular models and downstream genetic assays
Introduction and Methods
In this study, we demonstrate the capabilities of ChromaLIVE to unveil new kinetic insights and discriminate:
- Fast- from slow-acting compounds
- Transient from endpoint phenotypes
- Compounds with a similar class of MoA
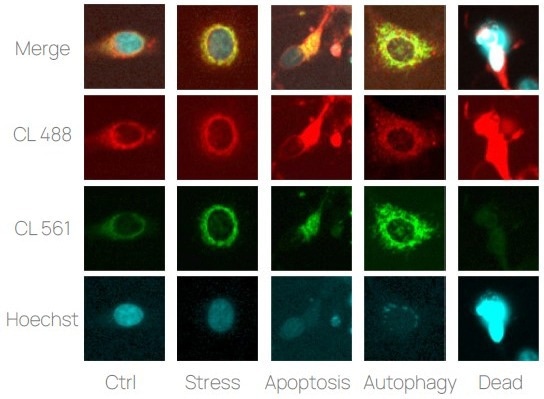
Figure 1. ChromaLive imaging examples. Examples of MCF-7 cells presenting various phenotypes. The experiment included 2 channels dedicated to ChromaLIVE and 1 channel dedicated to Hoechst. Image Credit: Image courtesy of Felix L-Perusse et al., in partnership with ELRIG (UK) Ltd.
We collected 7 kinetic measurements (3 hours, 6 hours, 12 hours, 18 hours, 24 hours, 48 hours, and 72 hours postaddition of the compounds) of 2D cultures of MCF-7 cells stained with ChromaLIVE and treated with 8 different concentrations of 14 well-annotated compounds.
Discriminating fast- from slow-acting compounds
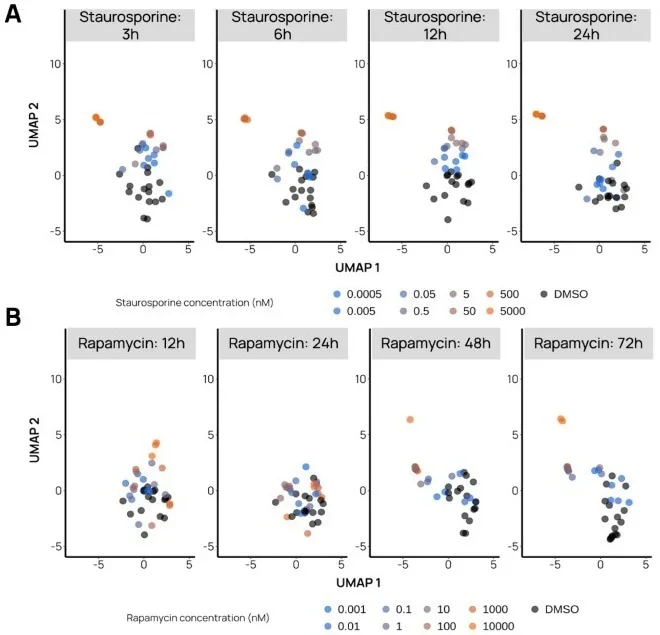
Figure 2. Time-dependent UMAPs discriminating fast- from slow-acting compounds. A. Example of Staurosporine, a fast-acting compound inducing apoptosis, for which a distinct phenotype is already observable at 3 h for the 2 highest concentrations (500 and 5000 nM). B. Example of Rapamycin, a slowacting compound inducing autophagy, for which distinct phenotypes start to be observable at 48 h and even more so at 72 h. Black dots represent negative control wells (DMSO), while the bright orange dots represent the two highest drug concentrations. Image Credit: Image courtesy of Felix L-Perusse et al., in partnership with ELRIG (UK) Ltd.
We capitalized on a wide range of kinetic measurements to help us gain further insights into the complex pharmacodynamics of well-annotated compounds. We created time-dependent UMAP visualizations to evaluate the occurrence of compound action over time.
Interrogate transient phenotypes
Time-dependent hierarchical clustering and UMAP can also highlight compound-induced transient phenotypes.
We show the effect of concentration and time for Thapsigargin, a compound that induces ER stress and cell death. These visuals allow us to observe that time, not concentration, predominantly describes the dynamic mechanism of Thapsigargin on cell killing.
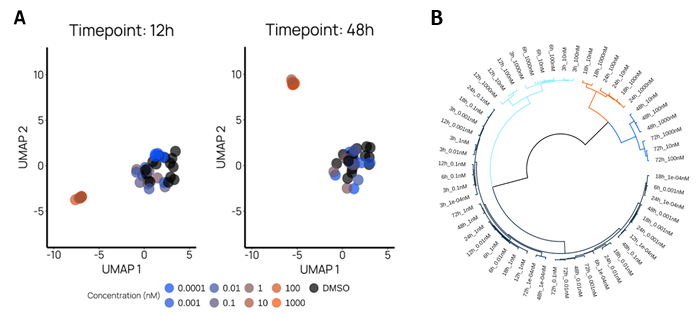
Figure 3. Investigating the transient phenotypes of Thapsigargin. A. Time-dependent UMAPs show the various concentrations of Thapsigargin with respect to the negative control (DMSO). B. We performed hierarchical clustering with averaged principal component values of Thapsigargin replicates for better and simpler visualization. We estimated, with gap statistic, that the optimal number of clusters is 4 (depicted in black, light blue, orange, and deep blue). These clusters clearly demonstrate the significant value of time, over and above concentration, in the phenotypic progression of Thapsigargin. Image Credit: Image courtesy of Felix L-Perusse et al., in partnership with ELRIG (UK) Ltd.
Differentiate colocalizing compounds
Time-resolved UMAPs offer insights into the subtle mechanistic differences of compounds. For example, Thapsigargin and Tunicamycin, two drugs known to induce endoplasmic reticulum (ER) stress but through different mechanisms, colocalize in phenotypic profiling assays. Below, we show that the two compounds act at different speeds, highlighting their different MoA before their phenotypes become confounded from 24 hours onward.
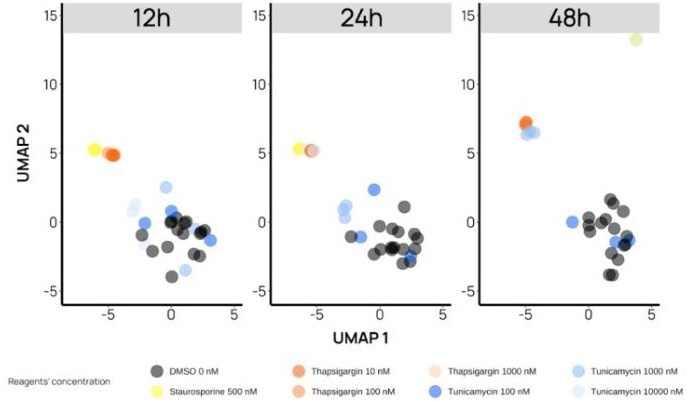
Figure 4. Discrimination of compounds sharing the same type of stress highlights their different MoA. In these UMAPs, Staurosporine 500 nM (yellow dots) serves as a positive control. At 12 h, the three (3) highest concentrations of Thapsigargin (orange dots) show a distinct phenotype from the negative controls (black dots), while for Tunicamycin (blue dots), the distinct phenotype appears at 24 h, only at the highest concentration. Throughout the assay, Thapsigargin and Tunicamycin phenotypes are distinct from Staurosporine (except for a single replicate of Tunicamycin at 48 h). Image Credit: Image courtesy of Felix L-Perusse et al., in partnership with ELRIG (UK) Ltd.
Conclusion
Live Cell Painting with ChromaLIVE emerges as a versatile, insightful, and complementary tool to endpoint assays for high-resolution exploration of cell phenotypes in the context of drug discovery:
- Can boost detection rates of bioactive compounds during screening campaigns;
- Highlight interesting phenotypes that multidose endpoint assays would not capture;
- Help better understand the compounds’ MoA and design adequate biochemical assays.
References
- Johan Fredin Haslum, et al. (2024). Cell Painting-based bioactivity prediction boosts high-throughput screening hit-rates and compound diversity. Nature Communications, 15(1). https://doi.org/10.1038/s41467-024-47171-1.
- Tromans-Coia, C., et al. (2023). Assessing the performance of the Cell Painting assay across different imaging systems. Cytometry. Part A: The Journal of the International Society for Analytical Cytology, [online] 103(11), pp.915–926. https://doi.org/10.1002/cyto.a.24786.
- Vanille Lejal, Rouquié, D. and Olivier Taboureau (2024). Cell morphology and gene expression: tracking changes and complementarity across time and cell lines. bioRxiv (Cold Spring Harbor Laboratory). https://doi.org/10.1101/2024.08.30.610494.
About Saguaro Biosciences
Saguaro builds next-generation cell culture products to advance their understandin g of disease and improve drug discovery success.
They are on a mission to develop truly innovative and useful products that can generate step-function improvements to these risky and complicated endeavours. Helping people live longer and healthier is the ultimate purpose that brings their team together.
About ELRIG (UK) Ltd.
The European Laboratory Research & Innovation Group (ELRIG) is a leading European not-for-profit organization that exists to provide outstanding scientific content to the life science community. The foundation of the organization is based on the use and application of automation, robotics and instrumentation in life science laboratories, but over time, we have evolved to respond to the needs of biopharma by developing scientific programmes that focus on cutting-edge research areas that have the potential to revolutionize drug discovery.
Comprised of a global community of over 12,000 life science professionals, participating in our events, whether it be at one of our scientific conferences or one of our networking meetings, will enable any of our community to exchange information, within disciplines and across academic and biopharmaceutical organizations, on an open access basis, as all our events are free-of-charge to attend!
Our values
Our values are to always ensure the highest quality of content and that content will be made readily accessible to all, and that we will always be an inclusive organization, serving a diverse scientific network. In addition, ELRIG will always be a volunteer led organization, run by and for the life sciences community, on a not-for-profit basis.
Our purpose
ELRIG is a company whose purpose is to bring the life science and drug discovery communities together to learn, share, connect, innovate and collaborate, on an open access basis. We achieve this through the provision of world class conferences, networking events, webinars and digital content.
Sponsored Content Policy: News-Medical.net publishes articles and related content that may be derived from sources where we have existing commercial relationships, provided such content adds value to the core editorial ethos of News-Medical.Net which is to educate and inform site visitors interested in medical research, science, medical devices and treatments.
Last Updated: Nov 18, 2024