IR nanochemical mapping involves combining atomic force microscopy and infrared microscopy to map the chemical properties of a sample at a nanoscale.
Skip to:

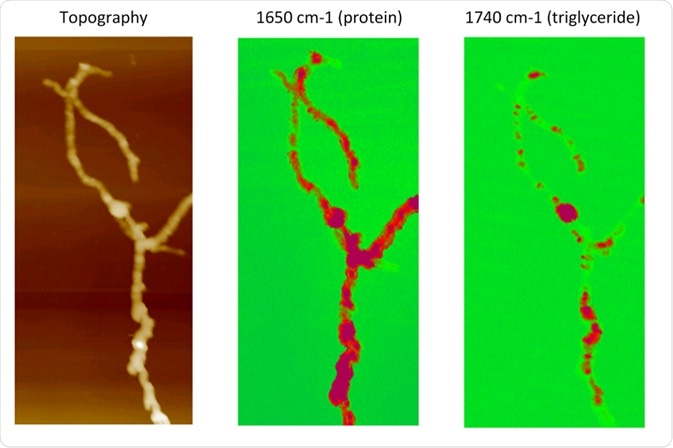
AFM-IR compositional mapping of Streptomyces bacteria. Left: AFM topographic image of bacterial cells. Middle: AFM-IR absorption at 1650 cm−1, corresponding to the amide I band associated with protein. Right: AFM-IR absorption at the carbonyl band 1740 cm−1, indicating the distribution of triglyceride vesicles within bacterial cells. Credit: A. Dazzi et al, Universite Paris-Sud, France.
Why infrared spectroscopy?
Many samples absorb light at a characteristic frequency, which is sometimes known as their "chemical signature". Linear spectroscopy can be performed using blackbody sources and radiation generated by a synchrotron, while non-linear spectroscopy is performed using lasers and pulsed lasers. This type of microscopy uses infrared spectral analysis to achieve high lateral resolution and chemical identification of the sample.
Other methods, such as photon scanning, need very thin sample segments to achieve a high resolution. Also, there are no methods that separate the real part of the refractive index that is contributed by topography, and inhomogeneities from the imaginary part of the optical absorption.
What is AFM-IR?
Infrared atomic force microscopy (AFM-IR) requires the use of commercial atomic force microscopy. In this method, the sample is irradiated using a photon scanning microscope. Then the absorption of infrared rays leads to local dilation of the sample. This dilation is measured by how the atomic force microscope tip is optically deflected. As the laser is pulsed, the nature of dilation is also transient. This leads to the generation of information regarding the spatial resolution of the sample, and records the topography.
Experimental set-up
In this method, the sample is deposited on the upper side of a zinc selenium prism. Subsequently, an infrared laser is provided that reaches the surface that supports the sample. The sample is kept at a total reflection angle. This avoids the heating of the AFM tip due to the laser, and also reduces the intensity of background intensity. Additionally, the tip is coated with a thin gold layer to avoid the residual absorption by the tip of the AFM probe.
The incident light propagates through the sample, and these short pulses are produced using the "CLIO" free electron laser. This structure has a series of macro pulses that have a frequency of 25 Hz. The macro-pulses consist of 500 micro-pulses that are 2 picoseconds apart. The duration of a macro pulse equals 8 μs, applying an energy of around 1 mJ. The laser light is focused on a point on the sample of about 1 mm2. This region is so limited to avoid damaging the rest of the sample.
The AFM tip is in contact with the sample, and the expansion caused by the light leads to a movement in the tip. This deflection is monitored using a diode laser that carefully measures the vibration of the AFM tip. The topography of the sample is determined along with the absorption mapping of the sample.
Increased spatial resolution
The resolution of atomic force microscopy infrared is less than 100 nm. This resolution is limited by the size of the AFM tip, characteristics of the sample, and signal to noise ratio. A typical rate of diffusion of heat is 1 μm/μs. Knowing this rate of diffusion through a sample boosts resolutions as low as 20-30 nm.
Case studies of IR nanochemical mapping
IR nanochmical mapping has previously been used to map the chemical constituents of the E.coli bacterium, which is in the order of 2–6 μm long, 1–2 μm wide, and 500 nm tall. AFM-IR was used for topography and chemical mapping of the bacteria. Using this technique, the scientists were able to observe vesicles containing polyhydroxybutyrate (PHB) within a purple species of bacteria belonging to the Rhodobacter family.
Similarly, this method has also been used for mapping amide I on thin spectrally homogenous mapping, viruses infecting E.coli. In the case of the viruses, most of its weight is constituted of DNA. It further has a protein envelope called a capsid, and the virus injects the DNA into the bacteria through its tail.
After injection, the virus replicates inside the infected cell that leads to the generation of new capsids. For performing this experiment, the viruses were first dried and then subjected to the process of nano-chemical mapping.
Mapping chemical interfaces
In composite materials that are used in high-voltage insulation, the aging of interfaces can be a huge problem. In such cases, IR nano chemical mapping can be used to map the tracks in interfacial regions and buried channels.
Studies using this method show that the oxidation of epoxy resin is associated with the formation of interfacial tracks and this is preferentially present in the damaged regions. Whereas, the presence of silicone rubber remains unchanged throughout the material as its spectra also remain unchanged post electrical aging.
AFM tip properties
The highest resolution in this method can be maintained by maintaining the integrity of the atomic force microscopy tip. In other methods that involve contact mode do not provide a means to obtain highly resolved images as the wear and tear of the atomic force microscopy tip often leads to low resolution and sample damage. To counter this, tapping mode is used for AFM which involves lightly tapping the sample surface to avoid lateral forces and damage to fragile samples.
Sources
- Dazzi, Alexandre & Prazeres, R & Glotin, François & Ortega, J.M. (2009). Nano-chemical mapping performed by an AFM-based ("AFMIR") acousto-optic technique and applications. researchgate.net.
- Morsch, S., Basidas, P. D., Rowland, S. (2017). AFM-IR insights into the chemistry of interfacial tracking. Journal of Materials Chemistry A. pubs.rsc.org.
Further Reading
Last Updated: Jun 3, 2019