Dielectric spectroscopy is a type of impedance spectroscopy that measures the dielectric properties of a system as a function of frequency. The external field interacts with the dipole moment of the sample which is expressed as its permittivity.
Dielectric spectroscopy can also be used to characterize electrochemical systems by measuring impedance of the system. Impedance is the opposition to a flow of alternating current.
Dielectric spectroscopy can make use of a number of mechanisms, depending on the response of the system to the applied field. When a field is applied to a neutral atom, it displaces the electron density of the atom. This is called electronic polarization. Other mechanisms that can be used for measurement are atomic polarization, dipole relaxation, ionic relaxation, and dielectric relaxation.

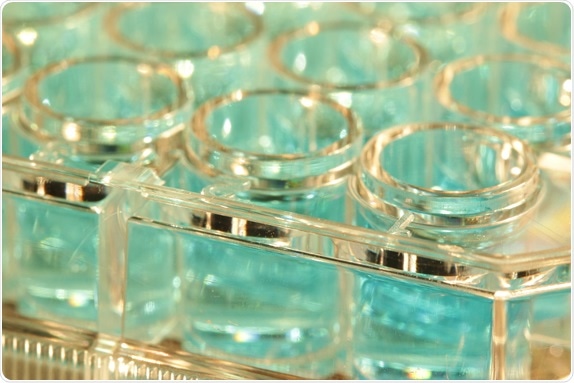
Laboratory microplate ready for spectroscopy reading. Image Credit: Schlyx / Shutterstock
Uses for Dielectric Spectroscopy
Dielectric spectroscopy is used extensively in the study of surfaces and coatings, and in detecting corrosion. Dielectric relaxation spectroscopy (DRS) is commonly used for studying surfaces. Dielectric relaxation is caused by the movement of dipoles and electric charges under an applied alternating field. These mechanisms tend to be relatively slow. In one type of application, DRS is used to observe the molecular dynamics of small volume polymer samples and self-assembled monolayers. The technique can detect motions such as reorientations and rotations of molecules in the sample. Interdigitated electrodes (IDEs) are used to make the measurements.
Another example of an application of DRS is a study of aqueous solutions of KCl and CsCl. The study gave new insights into the interaction of the electrolytes with the solvent. The spectra showed a decrease in bulk-water relaxation time with increasing concentrations of electrolytes, and was proportional to the surface-charge density of the cation.
Water Structure
In another study of the dynamics of water, dielectric spectroscopy was used to measure the dielectric constants of glucose solutions from 0.5 GHz and 12 THz. Analysis of the resulting spectra showed that hydrated water surrounding glucose molecules behaves in a mono-modal relaxational dispersion with 2-3 times slower relaxation times than unperturbed bulk water and with a hydration number of about 20. The spectra also revealed the presence of other species of water with distorted tetrahedral hydrogen-bonded water structures, and increases in the relative proportion of non-hydrogen-bonded water molecules. They concluded that saccharide solutes destructure hydrogen bonds.
Protein Movement
Dielectric spectroscopy can also answer questions about low-amplitude motions of proteins. These vibrational modes occur on the picosecond to nanosecond time scale. In one study, a dielectric spectrometer was used to measure the response of lysozyme solutions over a range of 65 to 700 GHz. They found that each molecule of lysozyme is surrounded by a layer of water molecules that behave as if they are an integral part of the protein. Computational models of the protein’s dynamics compared poorly with the experimental results.
Dielectric spectroscopy also has applications in human health and medicine, where it is known as bioelectrical impedance analysis. It is best known as a method for measuring body composition, including total body water and free fat mass.
Sources
- Dielectric relaxation spectroscopy, https://www.physics.ncsu.edu/clarke/research/ds.html
- Dielectric spectroscopy of aqueous solutions of KCl and CsCl, https://pubs.acs.org/doi/abs/10.1021/jp026429p
- Dielectric spectroscopy of proteins as a quantitative experimental test of computational models of their low-frequency harmonic motions, https://pubs.acs.org/doi/abs/10.1021/ja200566u
- Broadband dielectric spectroscopy of glucose aqueous solution: analysis of the hydration state and the hydrogen bond network, https://aip.scitation.org/doi/abs/10.1063/1.4922482?journalCode=jcp
Further Reading
Last Updated: Feb 26, 2019