Gas chromatography-mass spectrometry (GC-MS) is a tool that is used to separate, quantify, and analyze organic compounds that are naturally volatile. This article describes how to interpret and present GC-MS results in a publication, for all purposes.
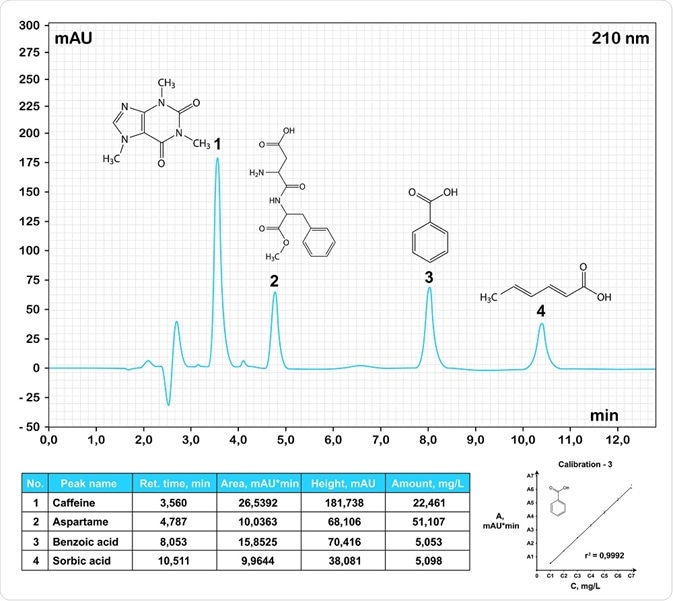
 HPLC chromatogram of common food additives. Chromatos | Shutterstock.
Understanding GC-MS
Gas chromatography is used to separate the components of a sample and provide a spectral signature for it. The procedure involves injecting the sample into the injection port of the gas chromatography device, which then vaporizes the sample. Post vaporization, the various components can be separated and analyzed as each of them results in a different spectral peak.
Retention time is the time that passes between injection and elusion of a sample component from the column, and this parameter is used to differentiate between the components. Another parameter is the size of the peak, which also gives information on the concentration and type of components of the sample.
Mass spectrometry analyses a sample by electrically charging the molecules of a specimen. These molecules are then accelerated through a magnetic field and broken into charged fragments.
Although gas chromatography can separate a compound into individual components, the identification process for specific components is not very reliable. In these cases, GC is used to separate the components before passing them through a mass spectrometer.
How to present GC-MS results
Retention Time
Retention time refers to the time a compound is retained in the gas chromatography column. This time is measured from the time that a sample is injected at, to the time that a sample finally elutes from the column.
Although this parameter can be used to differentiate between two compounds, it cannot be used as a reliable parameter to identify a compound. For example, if two compounds have similar retention periods it does not mean that the two compounds are the same, as several compounds have similar retention periods. Also, the interaction between different compounds may also increase or decrease the time they spend inside the column.
Size of the peaks of the spectra
Peak size is another parameter that is used to present the results of gas chromatography. The greater the size of the peaks, the higher the concentration of a component in a sample. The measurement of the peak is carried out from the base to the tip of the peak. The peaks of the spectra should be symmetrical, narrow and non-overlapping.
Peaks that are poorly shaped and consist of a long drawn out tail may indicate the presence of water in the sample. However, in some cases, certain compounds have a higher affinity with the detector. This leads to higher than actual peaks in comparison to other peaks on the chromatogram. For this reason, often standards with known concentrations are run to ensure accuracy.
Mass-to-charge Ratio (m/z)
This is the critical parameter that is derived from the mass spectrometry data. This ratio represents the mass of a given particle compared to the electrostatic charge that it carries. The ratio is termed as m/z ratio. The mass spectrum of each component is unique.
The mass spectra of the fragments are used as a puzzle to put together the mass of the whole particle. This parameter is mostly conclusive and provides an accurate method to identify a compound.
Further Reading
Last Updated: Apr 24, 2019