Cannabis remained present in all pharmacies as a medicinal plant with numerous uses at the close of the 19th century. Only later, when it was increasingly abused as an intoxicant, did it become demonized and ultimately banned.
In the intervening years, cannabis and its essential ingredients (cannabinoids), particularly THC and CBD, have undergone an astonishing renaissance as a potent drug. Meanwhile, the literature also refers to cannabis’ manifold applications.1,2,3
Given these discoveries, several countries are reviewing their current legislation with the intention of legalizing the controlled, medical use of cannabis. Cannabis contains over 60 cannabinoids of various concentrations, yet CBD or THC hemp predominate in illegal and legal markets.
Only THC has a psychoactive effect, however. This makes it crucially important to reliably distinguish between various kinds of hemp. This process of identifying types of hemp is usually undertaken by microscopy and HPLC, even though FTIR can be used to achieve this much more elegantly.
In this context, the combination of software-based spectra comparison by FTIR spectroscopy creates a perfect analysis tool. This is already being utilized in hundreds of pharmacies across the world with a fantastic rate of success.
| Keywords |
Instrumentation and Software |
| Natural substances |
ALPHA II FTIR spectrometer |
| Pharmaceutical ingredients (API) |
Platinum ATR |
| Cannabidiol (CBD) |
Quick Compare |
| Tetrahydrocannabinol (THC) |
Quant |
This article focuses on the rapid and reliable analysis of drugs in accordance with present pharmacopoeia regulations.
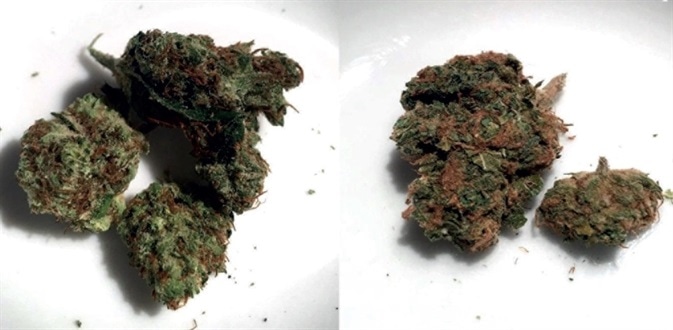
Figure 1: CBD (left) and THC cannabis (right) are indistinguishable to the naked eye.
Identification of Cannabis Petals
As is shown in Figure 1, CBD flowers cannot be distinguished from THC flowers with the naked eye (see Figure 1). Consequently, in order to tell the difference between plants containing THC or those containing CBD, chemical analysis methods based on the corresponding lead substances are necessary.
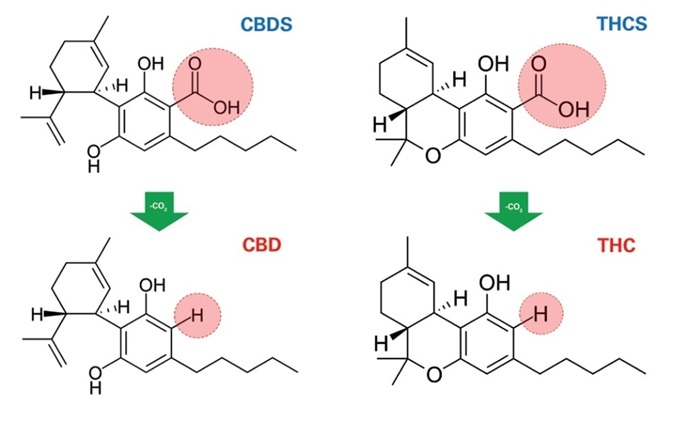
Figure 2: Thermal decarboxylation of CBDS and THCS to THC and CBD, respectively.
The fact that unprocessed flowers do not contain THC or CBD directly is worthy of note. Rather, they contain the corresponding acids THCS and CBDS. The actual active ingredients THC and CBD are formed through decarboxylation when the flowers are heated or smoked.
CBDS and THCS occur naturally in relatively high concentrations of between 5 and 30%. Consequently, it is possible to use FTIR to definitively ascertain the THC or CBD types, even by directly measuring ground-up flowers. Furthermore, it is easily possible to extract these compounds from the plant matrix using lipophilic solvent.
Methods and Instrumentation
During infrared spectroscopy, samples are irradiated with infrared light. The substance-dependent absorbance is then used in order to gather molecular information about the studied sample. An IR spectrum results, allowing the substance to be clearly identified in a manner similar to fingerprinting methods.
As illustrated in Figure 3, an ALPHA II FTIR spectrometer was used together with a platinum ATR unit in order to record all the following spectra. Normally, measurements in attenuated total reflection (ATR) are conducted in under a minute and they do not require any advanced sample preparation. These measurements are uncomplicated and, significantly, they are universally applicable for both liquids and solids.
Ease-of-use and functionality coalesce in the software used (either OPUS or OPUS TOUCH), providing extensive, automated methods of evaluation.
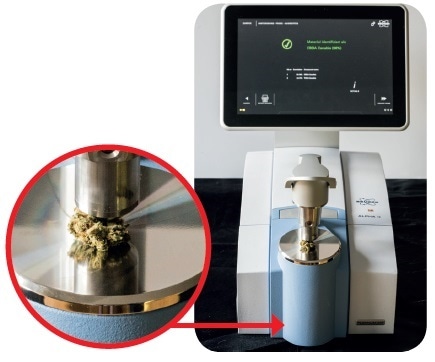
Figure 3: ALPHA II FTIR spectrometer equipped with Platinum ATR unit. The magnification shows the cannabis flower on the ATR diamond crystal.
Reference Spectra of the Key Ingredients
In order to reproducibly compare the cannabis flowers’ or extract's IR spectra with the corresponding identity-providing key substances, high quality THCS and CBDS reference spectra need to be available electronically.
Preparative thin-layer chromatography was used to isolate the substances of interest and their spectra were collected (Fig. 4; CBDS red, THCS blue). In order to verify the obtained data, it was compared to literature concerning the KBr spectra of THCS and CBDS, respectively.4

Figure 4: On the left, the spectra comparison of THCS (blue) and CBDS (red) is shown. On the right, the spectral differences are clearly visible from 400 to 1700 cm-1.
As shown in Figure 5, the correct identification of the isolated lead substances was further verified via a conversion of THCS to THC and of CBDS to CBD. The key ingredients’ characteristic bands were determined. A method was also created which guaranteed that further samples could be identified rapidly and safely.
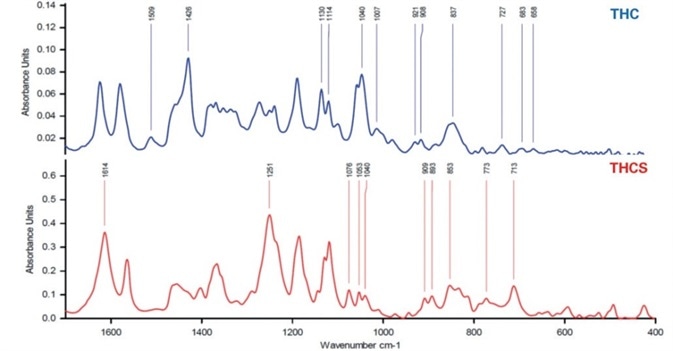
Figure 5: Decarboxylation of THCS (red) to THC (blue).
Sample Preparation
Two approaches exist for minimizing the plant matrix’s undesired signal contributions. One method involves using acetone or petroleum ether to extract hemp flowers. The filtrate which results can be concentrated via evaporation, before the sticky residue is applied to the measuring crystal. A similar method involves evaporating some drops of the filtrate on the ATR crystal directly.
The second approach involves performing an analysis of the flowers in their natural form. They should initially be ground using a small agate mortar, before the sticky, resinous, drug-rich plant parts are used for IR measurement.
Using this technique, it is possible to obtain high quality IR spectra with active ingredients (THCS and CBDS) in high quantities, with virtually no undesired plant matrix. Fortunately, by directly measuring cannabis flowers, it is also possible to identify THCS’ and CBDS’ substance-specific IR signals.
Evaluation by Spectra Comparison
In the measurements below, flowers were pressed directly onto the ATR crystal in order to measure the unprocessed cannabis. To perform the final evaluation, the measured sample spectrum was correlated with the entries of the reference database which was created previously.
Typically, in the case of pure substances, this correlation should exceed 95%. This value could also be lower or higher, depending on the specific analytical question. This study demonstrated that a reliable discrimination and identification of CBDS and THCS hemp could be ensured by a correlation limit of 90%.
The analysis result of a cannabis samples containing THCS is shown in Figure 6. The strong correlation between the sample spectrum (black) and the THCS reference is already very obvious
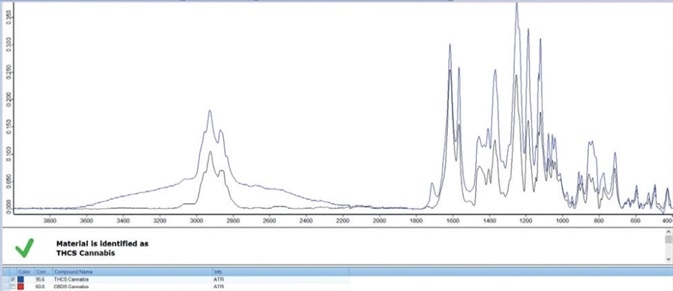
Figure 6: Analysis of a THCS-containing cannabis sample (black), THCS Reference spectrum (blue).
The agreement between the stored THCS reference and the sample spectrum is 95.6% according to the spectral comparison technique. The correlation with the CBDA reference when using this method is 63%, which is noticeably lower than the threshold value of 90%. This clearly identifies the sample as THCS cannabis, which in numerous countries is subject to strict legislation.
The analysis of cannabis samples containing CBDS is shown in Figure 7. There is an high correlation of 92.9% with the CBDS reference. This exceeds the defined 90% threshold. Conversely, there is just a 49% correlation with the THCS reference. The sample was consequently identified as CBDS hemp.
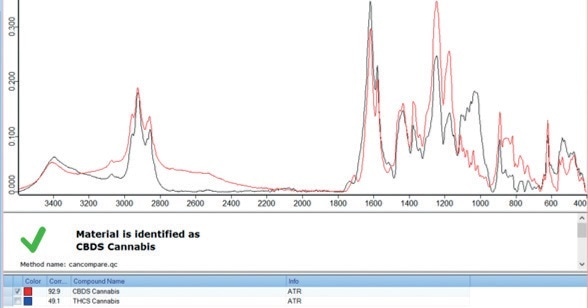
Figure 7: Analysis of a CBDS-containing cannabis sample (black), CBDS reference spectrum (red).
Conclusion
CBDS and THCS hemp can be reliably distinguished in a matter of seconds using FTIR spectroscopy. The potential of FTIR analysis greatly exceeds this use, however. Aided by suitable reference samples, it would be possible to create a calibration which allowed cannabis to be analyzed quantitatively.
In other words, the exact content could be determined by integrating substance-specific bands. Pharmacies already practice this technique often, in order to quantify the active ingredient content of established formulations. In future, this method may also be used to quantitatively analyze cannabis.
References
- Häussermann K., Grotenhermen F. und Milz E., Cannabis Arbeitshilfe für die Apotheke, Deutscher Apotheker Verlag Stuttgart, 2. Aufl. (2018);
- Grotenhermen F., Hanf als Medizin, Nachtschatten Verlag Solothurn (2015);
- Grotenhermen F. und Reckendrees B., Die Behandlung mit Cannabis und THC, Nachtschatten Verlag Solothurn, 7. Aufl. (2017);
- Hazekamp A., Peltenburg A., Verpoorte R. und Giroud Ch., J. Liquid Chromatog. & Tel. Technol. 28, 2361-2382 (2005)
- Schorno, H.J.X., Koch, H.C. Differenzierung von THC-Cannabis und CBD-Cannabis mittels FT-IR (2018)
About Bruker Optics
Bruker Optics, part of the Bruker Corporation is one of the world’s leading manufacturer and worldwide supplier of Fourier Transform Infrared, Near Infrared and Raman spectrometers.
Bruker entered the field of FTIR spectroscopy in 1974. The early instruments set new standards in research FTIR with evacuable optics, high resolution and automatic range change. Since then, the product line has been continuously expanding with instruments suitable for both analytical and research applications with exceptional performance characteristics.
Today, Bruker Optics offers complete technical solutions for various markets which cover a broad range of applications in all fields of research and development as well as industrial production processes for the purpose of ensuring quality and process reliability.
Bruker Optics’ R&D and manufacturing center is located in Ettlingen, Germany, technical support centers and sales offices are located throughout Europe, North and South America, Asia, India, Middle East and Africa.
Sponsored Content Policy: News-Medical.net publishes articles and related content that may be derived from sources where we have existing commercial relationships, provided such content adds value to the core editorial ethos of News-Medical.Net which is to educate and inform site visitors interested in medical research, science, medical devices and treatments.