Pesto’s roots can be traced back to ancient times, though it was only in the 1980s and 1990s that it began to gain popularity and see more routine use in North America.
Pesto’s primary base is consistent, though individual recipes tend to vary in terms of the inclusion and proportions of pine nuts, basil and olive oil. Individual manufacturers also began to develop their own distinct flavor profiles as canned and bottled pesto became more widely available.

Image Credit: LECO Corporation
These recipes tend to be carefully guarded trade secrets, but the analytical power of GCxGC TOFMS can provide insight into some of the differences between them.
In just a single run, the Pegasus® BT 4D from LECO is able to detect hundreds or thousands more individual analytes in comparison to conventional single-dimensional GC-MS analysis.

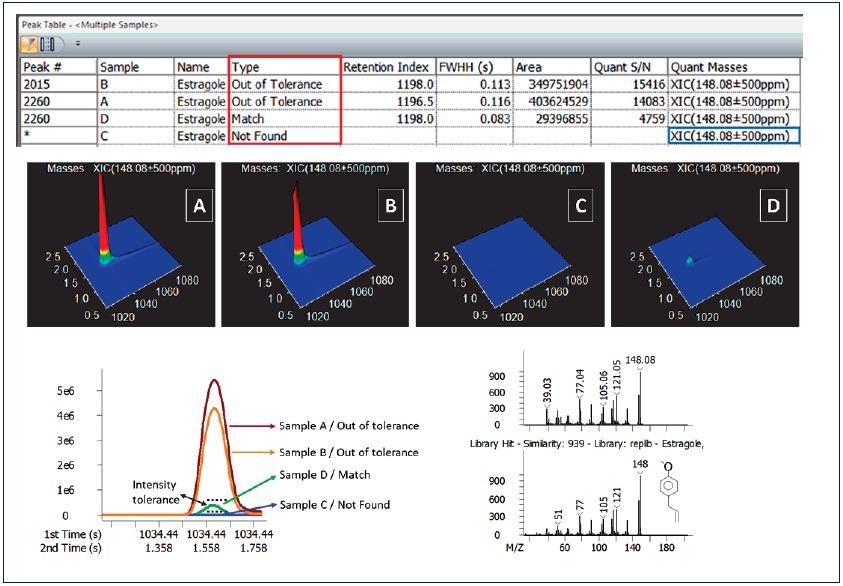
Example of the Reference feature in LECO's ChromaTOF SW. The automated comparison of four examined samples resulted in categorization of the Estragole peak as “Match” (sample D), “Out of tolerance” (samples A, B) and “Not-Found” (sample C). The peak intensity can be then also compared on (i) 3D plots of estragole and (ii) overlayed linear plots of the most abundant GCxGC slice. Image Credit: LECO Corporation
This instrument provides a plethora of rich, high-quality data, particularly when used with robust software tools such as the ChromaTOF® brand software.
The software’s ‘References’ function allows individual analytes to be selected and compared between samples or sample sets. The image below shows analyses of estragole in pesto from four different manufacturers.
In the example presented here, automated comparison of the four examined samples led to the estragole peak being categorized as ‘Match’ (sample D), ‘Out of Tolerance’ (samples A and B), or ‘Not Found’ (sample C).
It was also possible to compare the peak intensity 3D plots of estragole (i) and overlayed linear plots, illustrating the most abundant GCxGC slice (ii).
Analysts can be easily overwhelmed when presented with too much data, however. This is especially challenging when sorting through thousands of analytes to find the most significant and impactful ones.
ChromaTOF® Tile has been designed to help facilitate this task in a user-friendly, streamlined fashion.
The ChromaTOF® Tile data processing software platform was designed and developed using Professor Rob Synovec's Tile-based Fisher ratio approach. This software tool is able to intelligently compare sets of GCxGC data.

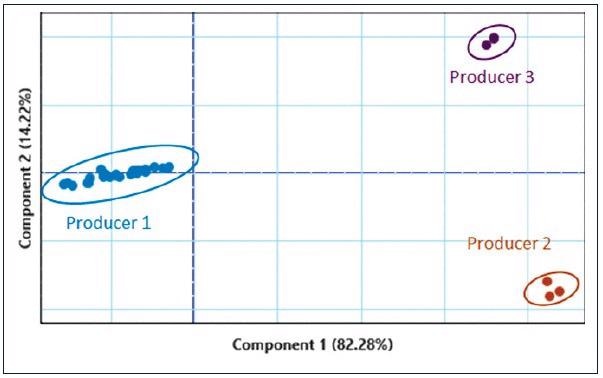
PCA plot with great separation of sample classes. Image Credit: LECO Corporation

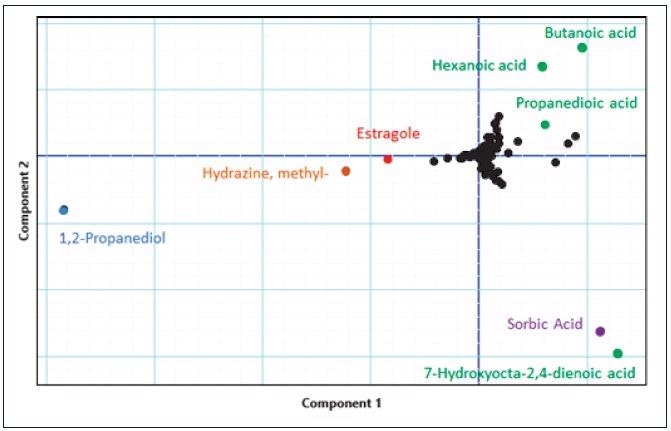
Loading plot of the above mentioned PCA plot with most marked distinguishing components identified as 1,2-Propanediol, butanoic acid, 7-Hydroxyocta-2,4-dienoic acid, hexanoic acid, propanedioic acid, Estragole, Methylhydrazine and Sorbic acid. Image Credit: LECO Corporation
This software was applied to eleven samples from three different manufacturers. Patterns and groupings began to form when this data was analyzed.
A loading plot and PCA plot highlighted a number of distinguishing components: 1,2-propanediol, butanoic acid, 7-hydroxyocta-2,4-dienoic acid, propanedioic acid, hexanoic acid, methylhydrazine, estragole and sorbic acid.
By automatically breaking down this data, it was possible to develop a rapid, robust understanding of the products involved – a critical factor in consistent and high-quality product development or the interpretation of consumer test data.
About LECO Corporation.jpg)
In 1936, the Laboratory Equipment Company introduced the first rapid carbon determinator to the American iron and steel industry. Today, 75 years later, LECO is recognized globally as a leader in innovative analytical instrumentation, mass spectrometers, metallography and optical equipment, and consumables.
LECO's broad selection of innovative instrumentation incorporates trendsetting automation, easy-to-use software, and the latest technologies into ergonomic designs. This results in instruments that are fast, accurate, and user-friendly—allowing you to increase productivity by achieving a level of throughput that was once unobtainable for many lab managers.
Our four diverse product lines offer you analytical solutions in five different market areas, meeting objectives for a wide variety of applications and scientific techniques. These market areas are described below.
Inorganic analysis
Determinators for carbon, sulfur, hydrogen, nitrogen, and oxygen used for metal and inorganic analyses; glow discharge spectrometers for bulk and/or quantitative depth profile analysis.
Organic analysis
Determinators for carbon, sulfur, hydrogen, nitrogen, and oxygen; analyzers for fat, protein, ash/moisture, mercury, and calorific value.
Microstructural analysis
Metallographic sample preparation equipment; macro and microindentation hardness testers; microscopes; image analysis and management systems; optical accessories.
Separation science (Mass spectrometry)
Fast GC-TOFMS and LC-TOFMS systems with ChromaTOF® software dedicated to a wide variety of organic applications; GCxGC-TOFMS and GCxGC FID/ECD systems offer increased separation power.
Ceramics
Crucibles, ladles, stopper rods, nozzles, kiln furniture, and pressed refractory shapes for the foundry and investment casting industry.
Sponsored Content Policy: News-Medical.net publishes articles and related content that may be derived from sources where we have existing commercial relationships, provided such content adds value to the core editorial ethos of News-Medical.Net which is to educate and inform site visitors interested in medical research, science, medical devices and treatments.