Thermo Scientific™ NanoDrop™ Microvolume UV-Vis Spectrophotometers have been trusted in laboratories for over 20 years. With four models to choose from and software add-ons that enhance performance and compliance.
The NanoDrop Ultra Microvolume UV-Vis Spectrophotometer and Fluorometer series, introduced in February 2025, builds on over 20 years of trusted laboratory performance. With four models to choose from and software add-ons for enhanced functionality and compliance, the NanoDrop Ultra family of spectrophotometers and fluorometers offers customized analytical solutions for applications ranging from research to manufacturing.
Instrument highlights
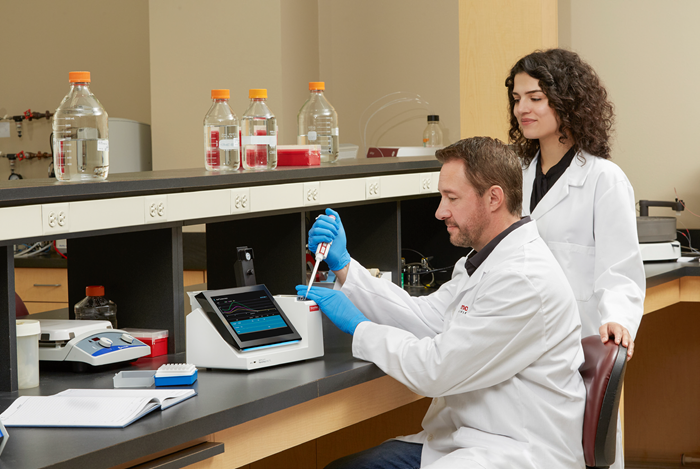
Image Credit: Thermo Fisher Scientific - UV-Vis Spectroscopy
Download the Brochure for More Information
Two answers on one pedestal
With the NanoDrop Ultra FL and NanoDrop UltraC FL instruments, users can analyze highly concentrated samples without dilution or assess dilute, contaminated samples with the sensitivity and specificity of fluorescence, all on a single device.
- High sensitivity: Fluorescence-based quantification offers greater sensitivity than absorbance, detecting as low as 0.1 ng/µL dsDNA for precise measurements.
- Sample prep calculator: An integrated reagent calculator simplifies sample preparation by determining the optimal amounts of dye and buffer needed.
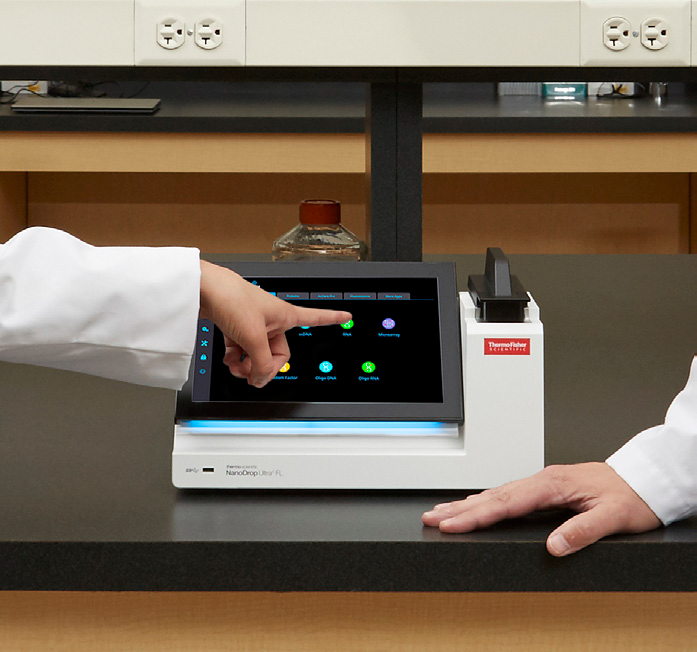
Image Credit: Thermo Fisher Scientific - UV-Vis Spectroscopy
dsDNA Dynamic Range. Source: Thermo Fisher Scientific - UV-Vis Spectroscopy
| dsDNA Dynamic Range |
|
|
| |
Lower Limit (ng/μL) |
Upper Limit (ng/μL) |
| NanoDrop Ultra Absorbance measurement |
1 |
27,500 |
| NanoDrop Ultra dsDNA BR Fluorescence kit |
10 |
1,000 |
| NanoDrop Ultra dsDNA HS Fluorescence kit |
0.1 |
100 |
RNA Dynamic Range. Source: Thermo Fisher Scientific - UV-Vis Spectroscopy
| RNA Dynamic Range |
|
|
| |
Lower Limit (ng/μL) |
Upper Limit (ng/μL) |
| NanoDrop Ultra Absorbance measurement |
0.8 |
22,000 |
| NanoDrop Ultra RNA HS Fluorescence kit |
0.2 |
100 |
The NanoDrop Ultra fluorescence kits have been optimized for microvolume measurements. Performance of other fluorescence dyes / reagents on the microvolume pedestal cannot be guaranteed.
Source: Thermo Fisher Scientific - UV-Vis Spectroscopy
| Description |
Measurement Modes |
Part Number |
| NanoDrop Ultra |
Pedestal Absorbance |
ND-Ultra-GL |
| NanoDrop UltraC |
Pedestal Absorbance, Cuvette Absorbance |
ND-UltraC-GL |
| NanoDrop FL |
Pedestal Absorbance, Pedestal Fluorescence |
ND-UltraFL-GL |
| NanoDrop UltraC FL |
Pedestal Absorbance, Cuvette Absorbance, Pedestal Fluorescence |
ND-UltraCFL-GL |
Image Credit: Thermo Fisher Scientific - UV-Vis Spectroscopy
Confidence the sample is clean
Common contaminants such as phenol or guanidine salts can falsely elevate sample concentration or inhibit downstream reactions. This is why purity ratios alone aren’t always enough to determine if a sample is clean for research.
Thermo Scientific™ Acclaro™ Sample Intelligence Technology enhances contaminant detection by recognizing multiple undesired substances—even identifying DNA contamination in RNA samples.
- Contaminant detection & analysis: Acclaro provides a comprehensive evaluation of sample purity, allowing for absorbance correction and ensuring users can identify, quantify, and mitigate contaminants with confidence. It now also enables DNA and RNA differentiation in plant and bacterial samples, benefiting researchers in agriculture, plant biology, microbiology, and genetic engineering.
- Sample integrity insight: Real-time alerts notify users of bubbles in a sample, which, if undetected, could lead to inaccurate measurements, ensuring more reliable and precise results.
Contaminants Identified. Source: Thermo Fisher Scientific - UV-Vis Spectroscopy
| dsDNA |
RNA |
Protein A280 |
| Protein |
Protein |
DNA |
| Phenol |
Phenol |
|
| Guanidine HCL |
Guanidine Isothiocyanate |
|
| Mammalian RNA |
Mammalian DNA |
|
| Plant RNA |
Plant DNA |
|
| Bacteria RNA |
Bacteria DNA |
|
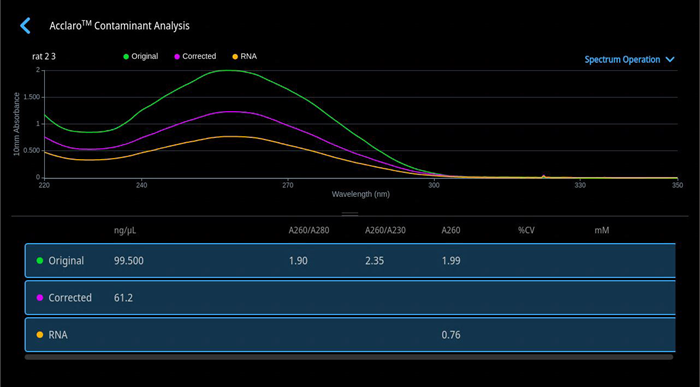
Acclaro Contaminant Software Screen. Software identified RNA contaminating a dsDNA sample and provides a corrected dsDNA concentration. Image Credit: Thermo Fisher Scientific - UV-Vis Spectroscopy
Automated calculation of reaction volumes
Determining the desired sample concentration is just the first step—calculating the exact amount needed for downstream reactions can be time-consuming.
With a built-in library of kits (or the option to add your own), the software automates the calculations, saving time and reducing errors. The qPCR recipe calculator simplifies reaction setup by providing precise preparation guidelines based on your sample’s concentration.
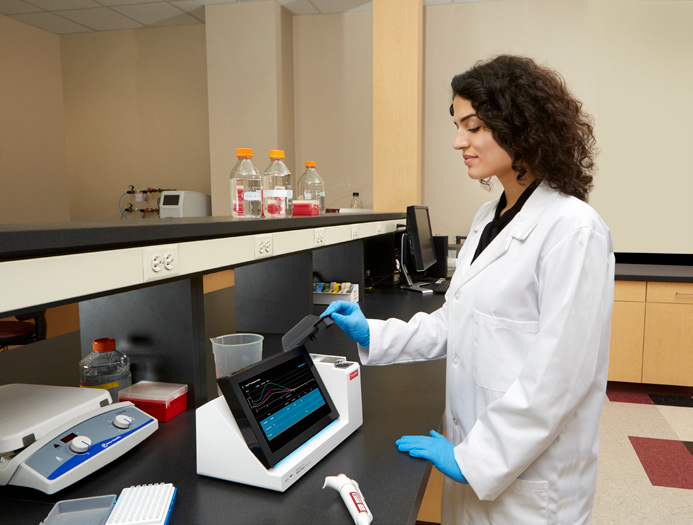
Image Credit: Thermo Fisher Scientific - UV-Vis Spectroscopy
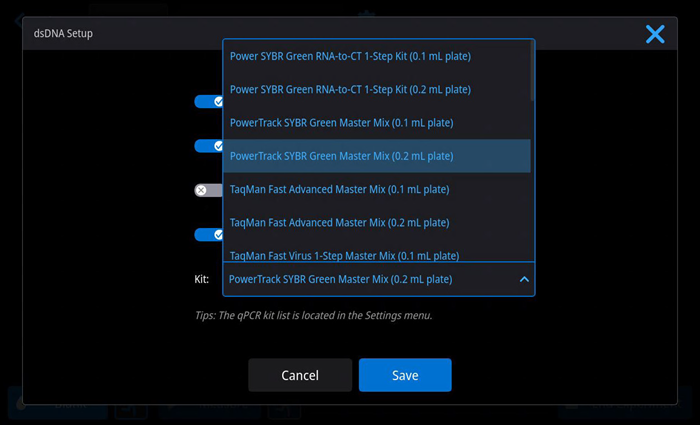
Choose your kit from the dsDNA Setup page. Image Credit: Thermo Fisher Scientific - UV-Vis Spectroscopy
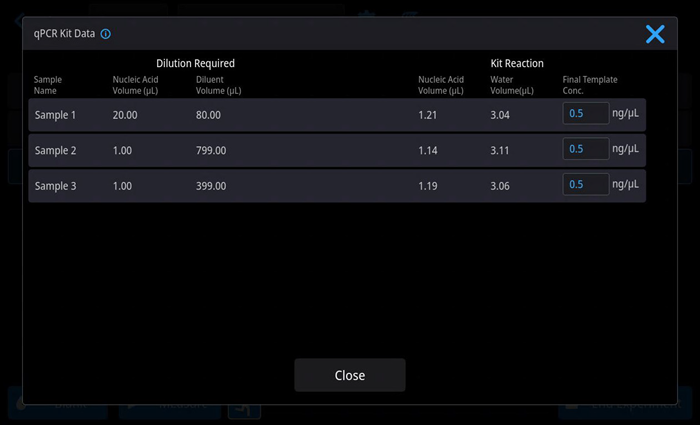
Software guides you to prepare your qPCR reaction. Image Credit: Thermo Fisher Scientific - UV-Vis Spectroscopy
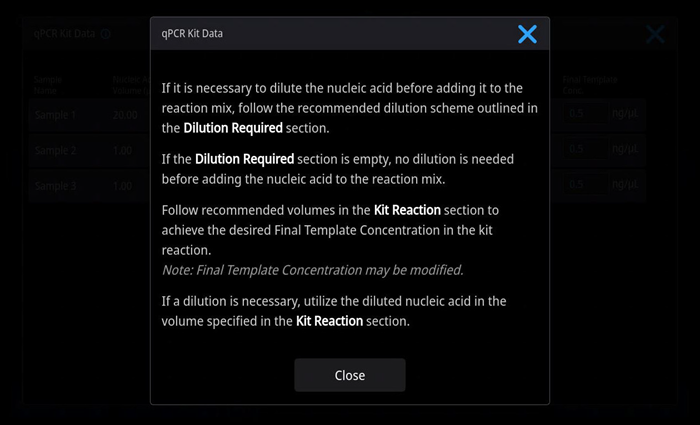
Tools tip walk you through how to read prior table. Image Credit: Thermo Fisher Scientific - UV-Vis Spectroscopy
Download the Brochure for More Information
Archive options for all
Easily save and access data by connecting your NanoDrop Ultra spectrophotometer or fluorometer to a network. Whether storing data in the cloud, on a network hard drive, or within a laboratory information management system (LIMS), flexible options ensure efficient workflow integration.
- Export to the cloud: Save data directly to popular cloud storage services, including Microsoft OneDrive, Google Drive, and Thermo Fisher Connect.
- Direct LIMS integration: Transfer data seamlessly into your LIMS using an integrated RESTful API.
- Customized data export: Preview and tailor exported data files to ensure they meet downstream requirements.
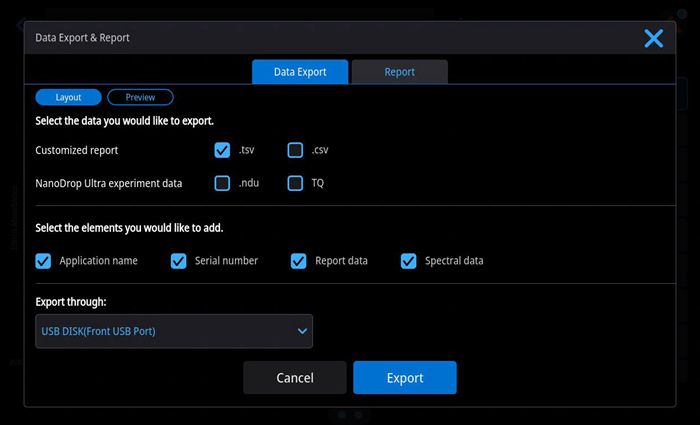
Export data in multiple file formats and select the type of data exported. Image Credit: Thermo Fisher Scientific - UV-Vis Spectroscopy
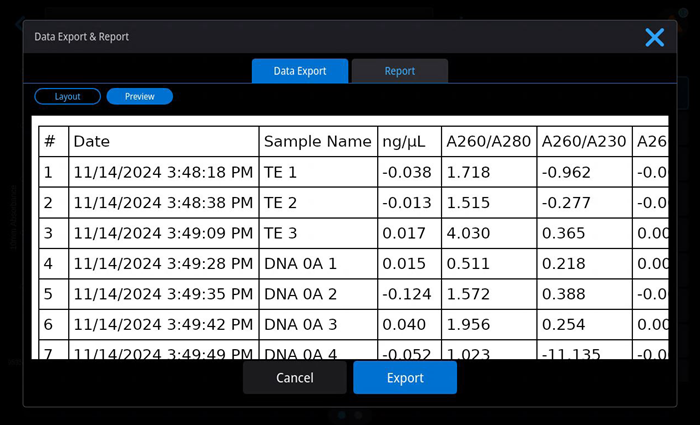
Preview option lets you see what your data file will contain. Image Credit: Thermo Fisher Scientific - UV-Vis Spectroscopy
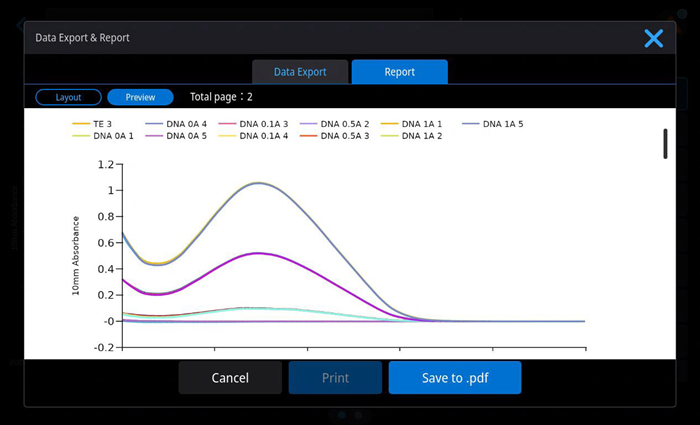
View the Report page prior to printing or export directly to .pdf. Image Credit: Thermo Fisher Scientific - UV-Vis Spectroscopy
21 CFR Part 11 compliance made easy
Optional Thermo Scientific™ SciVault™ 2 Software can be installed on either the instrument or a companion PC, providing laboratories with the necessary tools to comply with US FDA 21 CFR Part 11.
- Compliance made easy: Integrates seamlessly into the NanoDrop Ultra software interface, managing user account access, digital signatures, and audit logs.
- On-board options: Run the software directly on the local instrument with built-in user account management, or connect to a Windows domain for centralized authentication.
- Centralized solution: Install SciVault 2 on a central computer to manage user privileges and audit logs across multiple NanoDrop Ultra instruments in different labs.
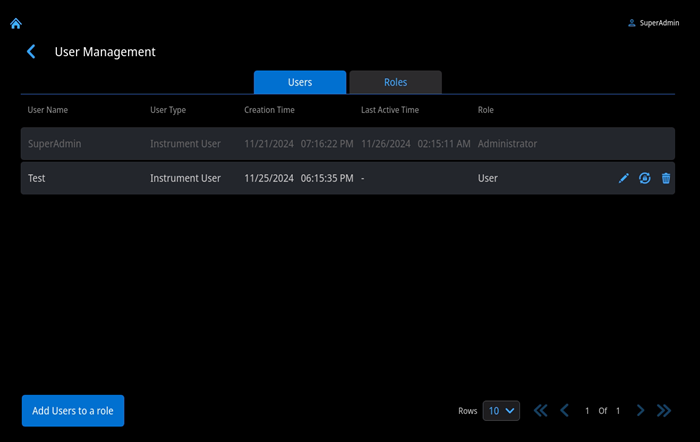
Image Credit: Thermo Fisher Scientific - UV-Vis Spectroscopy
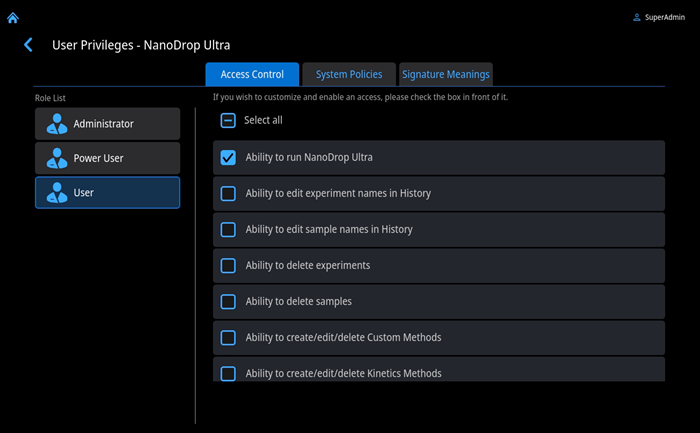
Image Credit: Thermo Fisher Scientific - UV-Vis Spectroscopy
Accuracy beyond expectations
Thermo Scientific™ Acclaro™ Pro Software delivers exceptional spectrophotometric accuracy when you need it. With the bundle purchase, new versions of the most popular measurement applications are unlocked from the factory, providing ± 5 % Error throughout the absorbance dynamic range.
- Accurate high-concentration measurements: Achieve absorbance measurements with ≤5 % error up to 550 Abs (10 mm equivalent), accommodating concentrations up to 400 mg/mL IgG or 18,000 ng/µL ssDNA.
- Quick dilution-free process: Perform triplicate measurements on the pedestal in under 2.5 minutes, eliminating the need for dilution.
- Enhanced calibration: Instruments purchased as part of a bundle receive an additional factory calibration, ensuring exceptional accuracy within Acclaro Pro applications.
Source: Thermo Fisher Scientific - UV-Vis Spectroscopy
| Description |
Part Number |
| NanoDrop Ultra Acclaro Pro Bundle |
ND-Ultra-AP-GL |
| NanoDrop UltraC Acclaro Pro Bundle |
ND-UltraC-AP-GL |
| NanoDrop FL Acclaro Pro Bundle |
ND-UltraFL-AP-GL |
| NanoDrop UltraC FL Acclaro Pro Bundle |
ND-UltraCFL-AP-GL |
Download the Brochure for More Information
Technical specifications
NanoDrop Ultra Microvolume UV-Vis spectrophotometers and fluorometers
Pedestal Absorbance Specifications. Source: Thermo Fisher Scientific - UV-Vis Spectroscopy
| Pedestal Absorbance Specifications |
| (NanoDrop Ultra, NanoDrop UltraC, NanoDrop Ultra FL, NanoDrop UltraC FL) |
| Minimum sample volume |
1 μL |
| Limit of Detection |
dsDNA (RNA) |
1 (0.8) ng/μL |
| BSA (IgG) |
0.03 (0.02) mg/mL |
| Maximum Concentration |
dsDNA (RNA) |
27,500 (22,000) ng/μL |
| BSA (IgG) |
820 (400 mg/ml) |
| Measurement Repeatability¹ |
Typical: 0.002 A (1.0 mm path) or 1%CV, whichever is greater |
| Photometric |
Range |
0.02 - 550 Abs (10 mm equivalent) |
| Accuracy² |
3% at 0.97 A, 302 nm |
| Pathlengths |
1.0 mm, 0.2 mm, 0.1 mm, 0.05 mm, 0.03 mm auto-ranging |
| Measurement & Data Processing Time |
≤ 7 sec |
| Acclaro Pro |
Measurement Repeatability |
< 3% CV |
| Measurement & Data Processing Time |
≤ 30 sec |
¹ SD of 10 individual samples measured at 0.97 A
² Absorbance expressed at Abs/mm at 25 °C
Cuvette Absorbance Specifications. Source: Thermo Fisher Scientific - UV-Vis Spectroscopy
| Cuvette Absorbance Specifications |
| (NanoDrop UltraC, NanoDrop UltraC FL) |
| Limit of Detection |
dsDNA (RNA) |
0.2 (0.16) ng/μL |
| BSA (IgG) |
0.006 (0.003) mg/mL |
| Maximum Concentration |
dsDNA (RNA) |
27,500 (22,000) ng/μL |
| BSA (IgG) |
2 (1) mg/mL |
| Photometric |
Range |
0.004 - 1.5 Abs (10 mm equivalent) |
| Pathlengths |
10 mm, 5 mm, 2 mm, 1 mm |
| Beam Height (Z-Height) |
8.5 mm |
| Temperature Control |
37.0 °C ± 0.5 °C |
| Stirring |
9 speeds |
Fluorescence Specifications. Source: Thermo Fisher Scientific - UV-Vis Spectroscopy
| Fluorescence Specifications |
| (NanoDrop Ultra FL, NanoDrop UltraC FL) |
| Minimum sample volume on pedestal |
2 μL |
| LEDs |
Blue (max ~470 nm) and Red (max ~635 nm) |
| Excitation Filters |
Blue (430-495 nm) and Red (600-645 nm) |
| Detector |
2048-element CMOS linear image sensor |
| Measurement & Data Processing Time |
≤ 20 sec for Blue LED; ≤ 40 sec for Red LED |
System Specifications. Source: Thermo Fisher Scientific - UV-Vis Spectroscopy
| System Specifications |
| (NanoDrop Ultra, NanoDrop UltraC, NanoDrop Ultra FL, NanoDrop UltraC FL) |
| Light Source (Absorbance) |
Xenon flash lamp |
| Detector |
2048-element CMOS linear image sensor |
| Wavelength |
Range |
190 - 850 nm |
| Accuracy |
± 1 nm |
| Resolution (Spectral Bandwidth) |
≤ 1.8 nm (FWHM at Hg 254 nm) |
| On-board Control |
Operating System |
Custom Linux |
| |
CPU |
1.6 GHz Quad Core |
| Display |
10.1” high definition, color display |
| Internal Storage |
64 GB; approximately 500,000 dsDNA measurements |
| Glove Compatibility |
Lab gloves |
| Audio |
Built-in Speaker |
| |
Connectivity |
2x USB-A Ports, 1x USB-C Port, Ethernet, Bluetooth³, Wi-Fi³ |
| US FDA 21 CFR Part 11 Compliance |
Comply using optional SciVault software installed on instrument or PC |
| Accessory support |
Mouse, keyboard, barcode reader, printer |
| Dimensions; arm up [W x D x H] |
12.6 x 7.1 x 11.0 in (32 x 18 x 28 cm) |
| Weight |
Approximately 9.0 lbs (4.1 kg) |
| Power consumption |
7W at Idle; 11 - 18W at Working Conditions |
| Battery (not currently available from Thermo Fisher Scientific) |
Supports USB-C battery (75Wh yields approximately 8 hrs of runtime) |
| Warranty |
2 years |
| PC operating system requirements for optional software |
Windows® 10 or Windows® 11 |
| Language Support |
Chinese, French, Italian, German, Japanese, Korean, Polish, Spanish, English |
³ Requires additional USB dongle, included with instrument
Reach goals
- Academic research labs – Support researchers in conducting studies and publishing groundbreaking findings.
- Biotech start-ups – Accelerate the development of new products.
- Academic teaching – Provide students with hands-on experience in molecular biology and experimental methodologies using an industry-leading instrument.
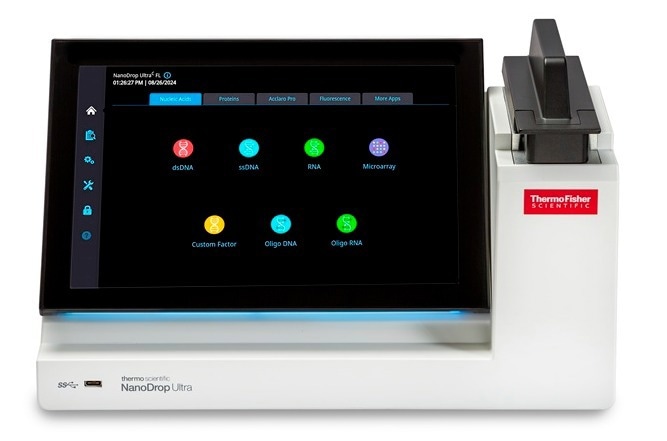
Image Credit: Thermo Fisher Scientific - UV-Vis Spectroscopy

Image Credit: Thermo Fisher Scientific - UV-Vis Spectroscopy