Post-mortem AD diagnosis is staged by the distribution and severity of these hallmarks – intracellular neurofibrillary tangles (NFTs) in neurons and extracellular amyloid-β (Aβ) deposits. Tangles are observed serially in the entorhinal cortex (EC), hippocampus (HC), thalamus, and neocortex, a sequence consistent with cognitive decline.
Understanding the affected regions’ cellular architecture could help reveal the underlying mechanisms of progression to pathology, which could have implications for early therapeutic interventions. While some relevant brain regions have been investigated, an extensive molecular characterization of regional differences in AD is lacking.
 Study: Single-cell multiregion dissection of Alzheimer’s disease. Image Credit: Marko Aliaksandr / Shutterstock
The study and findings
The present study presented a transcriptomic atlas of six distinct brain regions from individuals with and without AD. They performed single-nucleus ribonucleic acid (RNA) sequencing of nuclei from 283 post-mortem brain samples from 48 participants. Twenty-six individuals had a pathological diagnosis of AD.
Six anatomical regions of the brain were profiled – HC, EC, anterior thalamus (AT), prefrontal cortex (PFC), mid-temporal cortex (MT), and angular gyrus (AG). Seventy-six high-resolution cell types across 14 major cell type groups were annotated. The cell types were characterized based on their proliferative status and transcriptome size and compared with a previously published atlas.
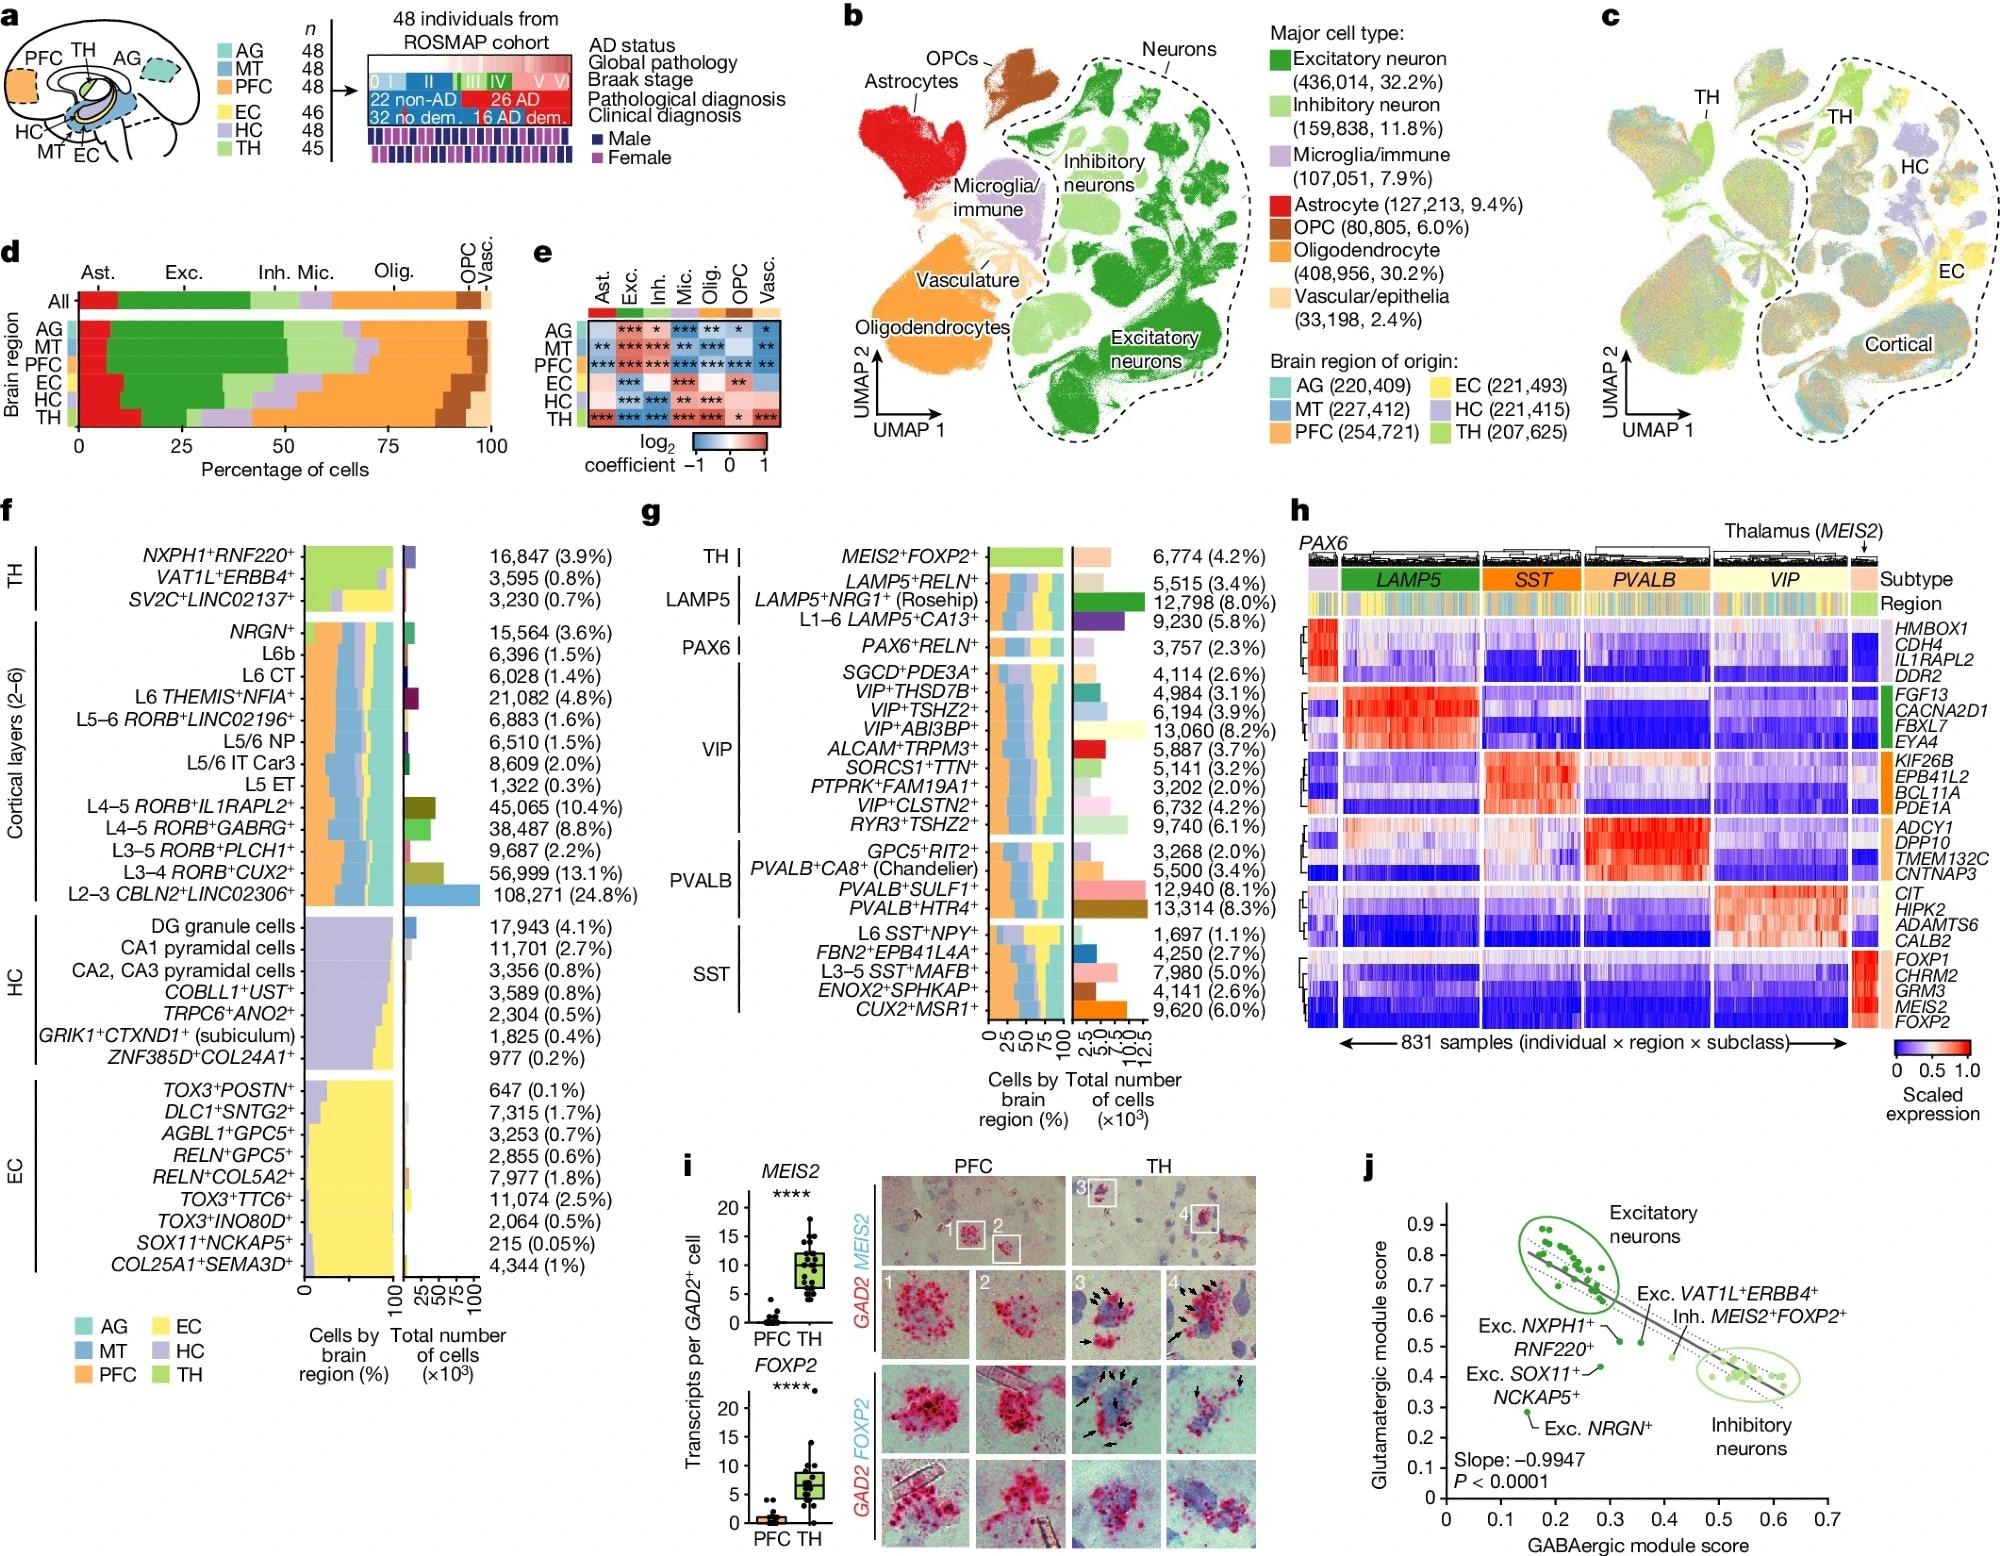 a, snRNA-seq profiling summary, covering 283 samples across 6 brain regions from 48 participants from ROSMAP, showing global pathology, Braak stage and pathological (26 AD and 22 non-AD) or clinical diagnosis of AD (16 AD dementia (dem.) and 32 no dementia). b,c, Joint uniform manifold approximation and projection (UMAP), colored by major cell type (b) and region of origin (c). d, The regional composition of major cell types. e, Relative enrichment of major cell types across regions by quasi-binomial regression. False discovery rate (FDR)-corrected P values are indicated by asterisks; ***P < 0.001, **P < 0.01, *P < 0.05. f,g, Global breakdown, region composition, enrichment and number of nuclei for excitatory (f) and inhibitory (g) neuronal subtypes. h, Gene expression analysis of the top four markers per inhibitory subclass, averaged at the sample by subclass level (columns). i, RNAscope validation of FOXP2 and MEIS2 as markers of the unique thalamus subtype, with quantification (left) performed using Student’s t-tests and representative images (right). The blue puncta represent MEIS2 (top) or FOXP2 (bottom) transcripts and red puncta represent GAD2 transcripts. FOXP2: n = 19 (PFC) and n = 22 (TH) cells; MEIS2: n = 35 (PFC) and n = 26 (TH) cells; each dot represents an individual cell, pooled from eight samples (four individuals; each had one PFC and one thalamus sample). j, Glutamatergic versus GABAergic scores for all neuron subtypes. The dotted lines represent the 95% confidence interval around the linear fit. P values were calculated using two-sided F tests. Ast., astrocytes; exc., excitatory neurons; inh., inhibitory neurons; mic., microglia/immune cells; olig., oligodendrocytes; vasc., vascular/epithelial cells.
The proportion of neurons increased from the TH (14.4%) to allocortical HC (32.2%) and neocortical (PFC, MT, and AG) areas (58.9%). Glia, including microglia/immune cells, astrocytes, oligodendrocyte precursors (OPCs), and oligodendrocytes, were less abundant in neocortical samples. Notably, the differences in composition of major cell types were consistent across participants, regardless of their disease status.
Further, the excitatory neuron subtypes were highly region-specific or mainly shared across neocortical regions. Conversely, all inhibitory neuron subtypes, except for one, were observed in five cortical areas. Besides, the researchers observed numerous transcriptionally distinct subsets for major glial cell types. Astrocytes exhibited the highest regional heterogeneity, with both thalamus- and neocortex-enriched subtypes.
Thalamic astrocytes were enriched for focal adhesion-related genes, while cortical astrocytes were enriched for those involved in glutamate processing and transport. Next, the team explored how AD impacts cellular composition. There were slight decreases in excitatory and inhibitory neurons and increased oligodendrocytes and vascular cells, driven by differences in PFC, EC, and HC regions, particularly in late AD.
Among excitatory neurons, one HC- and four EC-specific subtypes were less abundant in individuals with pathological AD diagnosis. Individuals with lower levels of these vulnerable subtypes performed worse on cognitive tasks. Besides, 391 genes showed significantly elevated baseline expression in vulnerable subtypes, including the Reelin signaling pathway, heparan sulfate proteoglycan biosynthesis, and kinase-associated genes.
Among inhibitory neurons, vulnerable and non-vulnerable subtypes varied in the expression of genes involved in heparan sulfate proteoglycan biosynthesis, enzyme-linked receptor protein signaling, and neuron projection morphogenesis. Moreover, vulnerable inhibitory subtypes exhibited elevated expression of the Reelin signaling pathway genes.
Further, the researchers computed differentially expressed genes (DEGs) for each excitatory subtype. Non-vulnerable subtype-linked DEGs were enriched for diverse functions, including heat-shock family chaperones, ubiquitin-ligase binding, and neuronal death mediators. By contrast, vulnerable subtype-linked DEGs were only enriched for mitochondrial oxidative phosphorylation.
Next, DEGs were assessed for each major cell type in each region and across regions. Excitatory and inhibitory neurons and astrocytes had the highest DEGs across all regions, with the most in the EC. Neuronal DEGs hardly overlapped across regions, suggesting that neuronal differences in AD were mainly determined by region of origin or subtype. OPC and microglia DEGs overlapped within non-neocortical regions.
Finally, the researchers explored the transcriptional changes associated with cognitive resilience (CR) in AD, defined as the difference between observed and expected cognition based on the level of pathology or the absence of cognitive impairment despite pathological AD. Astrocytes were consistently the only cell type with a high number of genes associated with CR across all nine measures of CR tested.
Various astrocyte genes consistently associated with multiple measures of CR, termed “CR-associated genes,” promote or possess antioxidant activities. Several CR-associated genes, including NAD(P)H quinone dehydrogenase 1 (NQO1), glutathione peroxidase 3 (GPX3), and ornithine decarboxylase 1 (ODC1), were positively associated with cognitive function, with their expression being the highest in astrocytes from individuals with the least cognitive decline.
Conclusions
Together, the study presented a transcriptomic atlas of six regions of the human brain from persons with and without AD. The researchers annotated regional cellular diversity, explored gene expression and differences in AD among cell types, and highlighted region-specific AD-vulnerable cell populations. Further, they uncovered astrocyte genes associated with CR in AD; these genes converged on choline metabolism and polyamine biosynthesis pathways, supporting these as attractive targets to promote CR.
 Study identifies brain pathway crucial for proper functioning of working memory