The European Pharmacopoeia, otherwise called Ph. Eur., is a single reference work dedicated to the quality control of medicines.
Ph. Eur. includes norms, recommends analytical methods and lists several properties defining quality control (QC) during the medicine production phase, the raw materials utilized and the instruments needed to execute such tests. These official standards are legally binding worldwide.
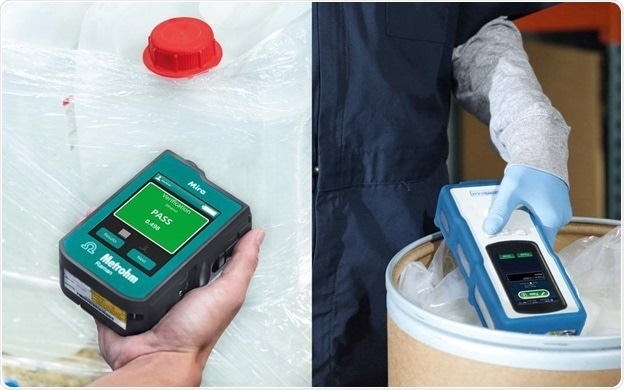
Image Credit: Metrohm Middle East FZC
Raman spectrometers, especially portable and handheld instruments, are being used predominantly for the QC of raw materials (RMID) and medicines. Requiring less technical skill, instrument interfaces are easy to use. For several samples with rapid, non-destructive measurements, they also offer flexible sampling options.
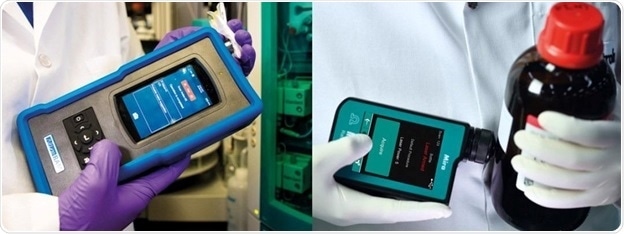
Metrohm’s Raman systems exhibit great flexibility — from see-through to standoff to immersion sampling. Image Credit: Metrohm Middle East FZC
An excerpt from the chapter Ph. Eur. 2.2.48 Raman Spectroscopy states:
“Raman spectroscopy is commonly used for qualitative and quantitative applications and can be applied to solid, liquid, and gaseous samples. Raman spectroscopy is a rapid and non-invasive analytical method and can be performed off-line, at-line, on-line, or in-line […] Raman spectrometers can be situated far from the point of measurement using long-distance optical fibers to collect the Raman signal."
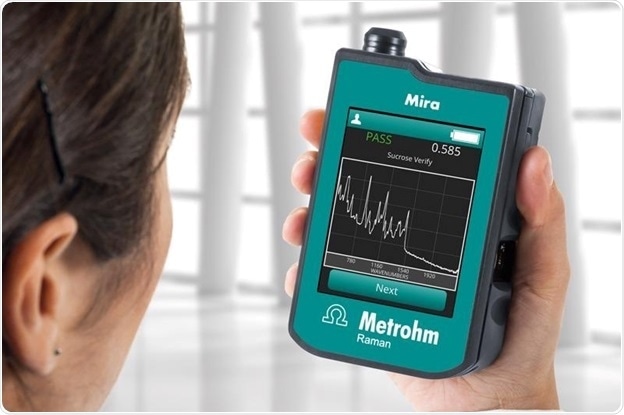
Handheld Raman for RMID in pharma and other regulated industries. Image Credit: Metrohm Middle East FZC
A revision of Ph. Eur. 2.2.48 was prompted by technological advancements and their increasing implementation in the pharmaceutical industry, which assures the dependability of Raman results. The updated chapter 2.2.48 was published in October 2021, in the Ph. Eur. Supplement 10.7, and will eventually take effect in April 2022.
Most of the Ph. Eur. 2.2.48 chapter has remained the same. The latest revision includes:
- Detailed procedures — for spectra comparison
- New requirements — for spectral resolution for qualitative Raman analysis utilizing a suitable reference material
- Updated requirements — for the Raman response-intensity scale
These new requirements across Metrohm Raman spectroscopy product lines are discussed further.
Spectral resolution
“Spectral resolution is the ability of a spectroscopic system to separate adjacent bands, which makes it possible to characterize complex samples (e.g., brand analysis, crystallinity, polymorphism). […] For identity tests, unless otherwise prescribed in a monograph, the spectral resolution must be less than or equal to 15 cm-1 (measured in the wavenumber range between 1000 cm-1 and 1100 cm-1).
The spectral resolution is verified using a suitable reference material. The instrument parameters used for the test, such as laser, slit-width and grating for dispersive instruments and circular aperture […] for FT-instruments, must be the same as those applied for sample measurements. For example, record the Raman spectrum of calcium carbonate for equipment qualification CRS, and determine the full width at half height (W1085) of the band located at 1085 cm-1. The spectral resolution (R) using calcium carbonate is then given by the following relation.”

Handheld Raman instruments: Metrohm MIRA P and NanoRam
All Metrohm NanoRam and MIRA P devices, along with NanoRam-785 and NanoRam-1064, are engineered and assessed to meet strict resolution needs so that they are suitable for the pharmaceutical industry.
Based on the instrument design, the spectral resolution is defined for the configuration of every specific instrument. The spectral resolution is from 3.5 cm-1 to 11 cm-1, depending on the instrument model.
The instrument resolution for all Metrohm’s portable Raman instruments is tested in the factory with calcium carbonate and is found to be lower than 15 cm-1 against a secondary USP (US Pharmacopeia) calcium carbonate’s reference standard during QC, according to ASTM E2529 — the same procedure suggested in the newly published Ph. Eur. chapter.
A final test report or certificate, including the spectral resolution, is packed with the device and sent to the customer (from April 2022 for MIRA P). This resolution is kept stable by the instrument’s optical design and remains fixed over time.
Also, the software applications of instrument control — Vision and BWAnalyst — have the performance test function that verifies spectral resolution utilizing the 1001.4 cm-1 peaks of polystyrene.

Handheld and portable Raman instruments from B&W Tek. Image Credit: Metrohm Middle East FZC
Response-intensity scale
“The verification of the response-intensity scale is principally performed for quantitative methods. Appropriate acceptance criteria will vary with the application. A maximum variation of ± 10% in band intensities compared to the previous instrument qualification is achievable in most cases. Response calibration may involve the use of white-light standards or luminescent glass (e.g., NIST SRM 2241).”
On the Handheld Raman Instruments
NanoRam and MIRA P systems are made for qualitative analysis, but not intended for quantitative purposes. Hence, relative intensity response is not a mandatory requirement for handheld Raman products.
Nevertheless, the of NanoRam series and MIRA P instruments are measured with an SRM calibration material that comes with a NIST standard (SRM 2241, SRM 2242) or NIST SRM 2241-traceable calibration standard to attain better uniformity among instruments.
In alignment with Ph. Eur. 2.2.48 and USP<858>, the NanoRam series instruments come with an acceptance criterion for relative intensity response in the validation of instrument performance.
Less than 10% relative intensity error is needed to pass the performance validation, using the factory-supplied polystyrene cap.
Portable Raman instruments: i-Raman series, QTRam, STRam and PTRam
The portable Raman instruments’ relative intensity response is measured with a proper NIST standard SRM calibration material to get better uniformity among instruments.
In addition, the Vision instrument control software comprises the performance test function that checks the intensities of various Raman peaks of polystyrene compared to its 1001.4 cm-1 peaks, to a maximum variation of ±10% in comparison with the previous instrument prerequisite.
Comparison procedures
Additional information for identification has been defined for qualitative methods.
“Several comparison procedures may be used, and the analyst must document and justify the method used and the specific acceptance criteria that allow a conclusion for identification. The spectra can be compared by either overlaying the spectra (in the whole spectral range or in the region of interest specified in the monograph) or by using mathematical calculations of the software. It is possible, for example, to perform:
- visual comparison based on band positions and relative intensities unless otherwise specified […]
- a statistical determination of the similarity between the spectra of the material to be examined and the reference standard […]
- evaluation by chemometric methods […]”
Although an experienced Raman spectroscopist can confidently visually compare spectra and test sample validity depending on fluorescence, peak location, signal-to-noise ratio and saturation, the extensive implementation of Raman in real-time means that complicated analysis needs to be done by the instrument and not the user.
Through correlation of a sample spectrum using library spectra, statistical comparison methods are employed mainly for the determination of unknowns.
The software performs library searches and provides a Hit Quality Index (HQI) value that indicates the correlation level as defined by a user-defined threshold.
Chemometric methods depend on dimensionality-reduction methods that are executed by the software — like Principal Component Analysis (PCA) — where the latest sample data is compared within a multivariate model produced from representative samples.
This enables high-precision evaluation of known materials depending on how well a spectrum fits within the model limits, which are identified by a confidence interval.
In medicine and raw material analysis, chemometric methods are employed to differentiate the consistency and quality of a material.
NanoRam instruments and MIRA P (along with its dedicated software, MIRA Cal P) employ both chemometric and statistical methods for the identification and verification of the sample depending on the requirements of the end-user.
Wavenumber accuracy requirements of Ph. Eur. 2.2.48
“Verify the wavenumber scale for Raman shifts using a suitable standard that has characteristic maxima at the wavenumbers under investigation, for example an organic substance such as polystyrene, paracetamol or cyclohexane[..]
A minimum of 3 wavenumbers covering the working range of the instrument intended for measurements should be selected. […]”
Consistent with the USP <858> and JP 2.26m, this chapter maintains the same requirements for Raman wavenumber accuracy.
All of Metrohm’s handheld Raman instruments meet these requirements. It is recommended that users perform validation tests for performance using polystyrene or any other ASTM Raman shift calibration material at regular intervals.
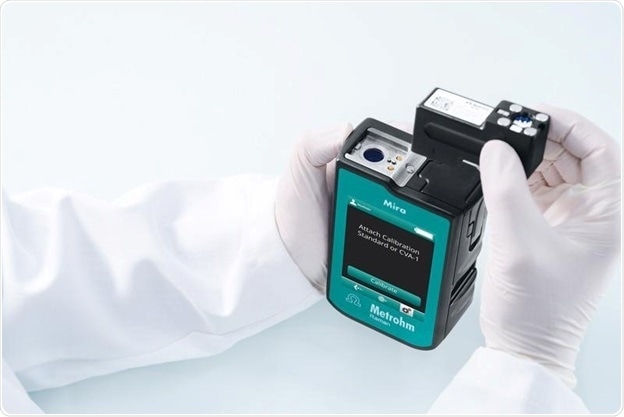
The Calibrate/Verify Attachment (CVA) shown here is a dual-ended accessory containing a toluene/acetonitrile ASTM standard for calibration/verification of the wavenumber axis and polystyrene for a second wavenumber verification according to Ph. Eur. 2.2.48. Image Credit: Metrohm Middle East FZC
The Vision and BWAnalyst software applications include performance tests for Raman wavenumber accuracy for the i-Raman series and other portable Raman products (STRam, QTRam, PTRam), having acceptance criteria as per the pharmacopeial requirements.
Metrohm’s unique way of compliance with Ph. Eur. 2.2.48
Better representation of the material
“When using Raman spectroscopy […] care must be taken to ensure that the measurement is representative. This can be achieved by, for example rotation of the sample, performing multiple measurements on different preparations of the sample, using orbital raster scanning (ORS), increasing the area of illumination by reducing the magnification, by demagnification of the laser beam or by changing the focal length between measurements to scan at different depths.”
To collect more representative data from a larger sample area, ORS™ is a proprietary method of Metrohm Raman for moving the excitation laser in a pattern across a sample, particularly on heterogeneous samples.
All MIRA instruments are engineered with ORS.
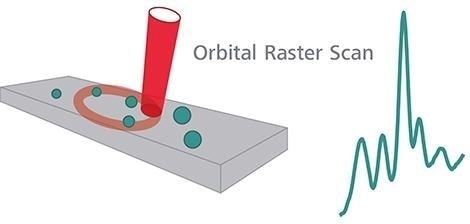
Orbital Raster Scan. Image Credit: Metrohm Middle East FZC
Metrohm: For end-to-end pharmaceutical analysis
Raman analyzers
Raman Analyzers are strong and dependable portable spectrometers for the identification and verification of materials. These instruments bring together practicality with commendable safety and deliver results within seconds.
- Simple, handy and practical
- Rapid and dependable results
- Non-destructive sampling and flexible accessories
- Rugged and strong
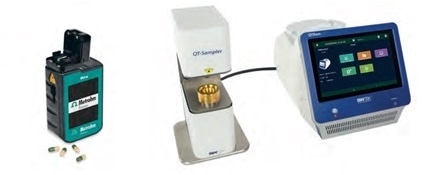
Image Credit: Metrohm Middle East FZC
Metrohm quality service
Service that users can rely on
Metrohm Quality Service programs offer scheduled preventive maintenance and extend the operating time and life of Metrohm systems, as well as provide fully compliant documentation.
The maintenance work is carried out by qualified and trained service engineers. Users can choose between various types of service contracts that will suit the users’ needs and budgets.
Regulatory compliance
The Metrohm Compliance Service guarantees compliance alongside statutory requirements for pharmaceutical companies.
Security of results — For the lifetime of the analyzer
The comprehensive services assure that the people in the laboratories can depend on the results achieved from Metrohm Systems all through their lifetime.
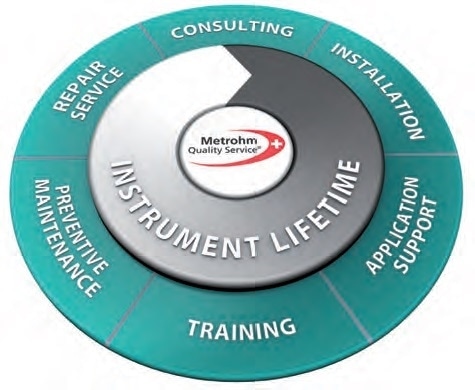
Image Credit: Metrohm Middle East FZC
About Metrohm Middle East FZC
Metrohm Middle East FZC is a subsidiary of Metrohm AG, Switzerland, located at Sharjah Airport International Free Zone, UAE. Metrohm’s Product range involves both Lab instruments & online Analysers for various industry segments - Water, Petrochemical, Pharmaceutical, Food and Beverages, Environmental Analysis, Chemical analysis, Research and development, Educational Institutions, Sewage Treatment and more.
MME has a team of well trained; knowledgeable and experienced team specialized in Product Management, Service and Application support. Apart from extending our support to distributors, MME also provides direct support and training to our customers on site or at our world class Regional Support Centre.
Sponsored Content Policy: News-Medical.net publishes articles and related content that may be derived from sources where we have existing commercial relationships, provided such content adds value to the core editorial ethos of News-Medical.Net which is to educate and inform site visitors interested in medical research, science, medical devices and treatments.