One of the fundamental purposes of biotherapeutic research, development, and production is to assure the safety and efficacy of medicinal products in clinical settings.
Analytical tools are critical in this effort, allowing researchers to evaluate the qualities of the active pharmaceutical ingredients (API), formulation, and final therapeutic product.
These critical quality attribute (CQA) assessments enable researchers to analyze and regulate product quality throughout development and manufacturing,1,2 resulting in better patient outcomes. To answer biotherapeutic research questions, researchers often need to gather reliable CQA data (Figure 1).
Obtaining appropriate property data for an application sometimes necessitates the employment of both complimentary and orthogonal analytical methods. These terms illustrate how information from distinct measures interacts with one another and how conducting both increases a researcher's understanding of a sample.
Understanding these correlations can assist scientists in choosing effective ways to acquire sufficiently precise data on the relevant CQAs for an application.
This article will focus on the definitions of these connections recently presented by Simon et al.3 While older literature examples may have somewhat different meanings for these terms, they typically agree on the main principles.
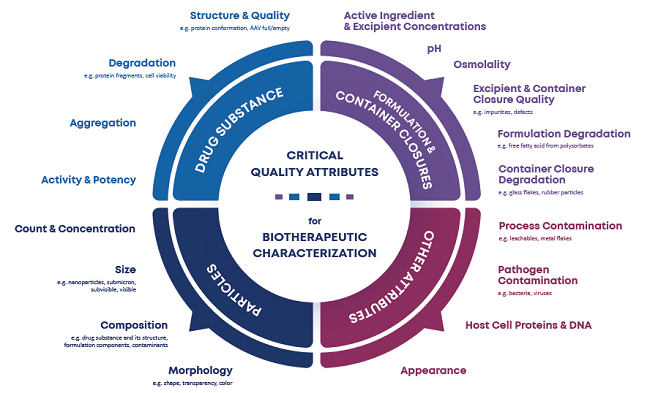
Figure 1. Various critical quality attributes that researchers may need to monitor. Image Credit: Yokogawa Fluid Imaging Technologies, Inc.
Definitions
Critical quality attributes (CQAs)
Critical Quality Attributes (CQAs) are properties of a biotherapeutic sample indicating its general stability and quality, which may be connected to product efficacy. These include the physical and chemical characteristics of the active pharmaceutical ingredient (API), API breakdown products (such as aggregates), and particle content.
Analytical technique
A technique for gathering information on at least one CQA for a medicinal product. Analytical approaches differ in terms of the sample properties they monitor, the dynamic range or species in a sample they evaluate (for example, size range for particle monitoring), and the measurement principle, or how the methodology gathers data and what bias or error is introduced.
Orthogonal techniques
Analytical approaches that monitor the same CQA(s) in a biotherapeutic formulation but use different measurement principles. Flow imaging microscopy and light obscuration are often orthogonal approaches; they both assess subvisible particle count and size, but do so by digital imaging and light blocking, respectively.
Complementary techniques
Analytical procedures that provide novel information about a biotherapeutic formulation in relation to a specific research subject. In general usage, this refers to strategies for measuring various CQAs.
Circular dichroism and dynamic light scattering are complementary techniques to flow imaging microscopy (FIM) for protein aggregation-focused applications; the former monitors a different sample property than FIM (protein conformation vs. subvisible particle content), whereas the latter monitors similar properties but over a different dynamic range.
Orthogonal techniques
An orthogonal methodology to a given method assesses at least one common application-relevant CQA while employing a distinct measurement technique. If applicable, the feature should be described throughout a comparable dynamic range (for example, monitoring particles in a certain size range).
Because of the distinct measuring concepts, each approach gives an independent assessment of a particular characteristic that may be compared to another. It should be emphasized that the common CQA must apply to a given application for the approaches to be orthogonal.
This distinction is critical when examining ways for collecting data on various CQAs; two methods that define several properties are only orthogonal for an application if at least one of the metrics they share is useful.
Orthogonal approaches are useful because they provide researchers with more reliable and accurate measurements of a specific property.4
Because of limitations in the measuring method used, each analytical approach is susceptible to bias or systematic inaccuracies in the data it produces. Bias can lead to orthogonal procedures providing different values for the same parameter.5
If a user just uses one method to characterize a CQA, it might be difficult to control for bias and other data-gathering problems. However, because orthogonal measurements are independent, researchers may cross-check and validate their findings to account for these flaws.
Assume a researcher has two orthogonal ways of assessing particle concentration and discovers a lower-than-expected result from one approach when describing a sample.
If the orthogonal approach yields a larger particle concentration, the researcher understands that the analytical methodology is not working properly.
While this might suggest a problem with data collection, it could also mean that something else in the sample has changed (for example, particle translucency), which only affected one technique due to bias.
If the orthogonal measurement likewise shows a low concentration, the researcher has more proof that the particle concentration in the sample has decreased, and bias is less likely to be at blame.
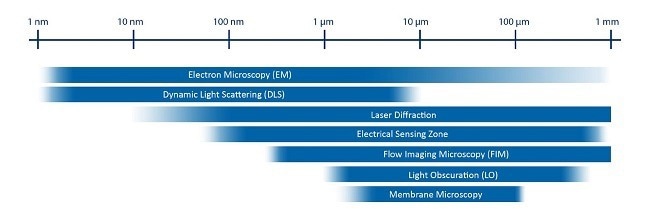
Figure 2. Size ranges for several common analytical techniques. Image Credit: Yokogawa Fluid Imaging Technologies, Inc.
Complementary techniques
A complementary technique to an existing strategy gathers extra information on the relevant CQAs for a specific application, including any orthogonal technique. In general, the term is frequently used to describe those that just measure distinct CQAs.
Complementary but not orthogonal techniques offer information on brand-new qualities that the other does not monitor, and most applications require all relevant sample attributes to be monitored.
As with orthogonal techniques, each approach must evaluate one application-relevant attribute for the two ways to be complimentary in that context. Techniques are complimentary when they assess distinct CQAs relevant to an application.
For example, if a researcher was looking at protein aggregation in a sample, they may utilize methods for measuring protein conformation and particle size as complementing methodologies.
Another option for techniques to be complementary is to measure the same characteristic but at distinct dynamic ranges.
In the above example, the researcher might employ one way to analyze nanoparticle size distributions and another to characterize subvisible particle size distributions as complimentary methodologies, even though both approaches characterize the "same" metric.
Orthogonal methods with flow imaging microscopy
This is mostly used to assess subvisible particle count, size, and shape. This data is produced by passing a liquid sample through a microfluidics channel and taking digital light microscopy photographs of any particles present.
FIM is a useful way of monitoring subvisible particles, however, other approaches can also offer similar information.
Researchers frequently benefit from using flow imaging as an orthogonal subvisible particle characterization tool with these other methods. In addition to FIM, researchers might examine the following common orthogonal subvisible particle measurements.
Light obscuration (LO)
Light obscuration, perhaps the most used subvisible particle analysis technique, captures subvisible particle counts and size distributions by passing a sample through a light source and counting and measuring the particles' shadows on the detector.
To satisfy standards like USP <787> and <788>, companies utilize LO to assess the quantity of particles greater than 10 and 25 µm in their parenteral drug products after lot release.6,7
Despite its ubiquity, LO has difficulty identifying transparent particles seen in biotherapeutic formulations8 and samples with particle densities of more than 20,000 particles per milliliter.
While its measuring approach is similar to that of FIM, LO can nearly always be employed as an orthogonal technique to FIM since it detects particles using light blocking rather than light microscopy and digital photography.
Table 1 compares FIM and LO instrument design and performance. Flow imaging particle data provides more accurate transparent particle counts and sizing5,9 and has a greater upper concentration limit (approximately 1,000,000 particles/mL) than LO.
Table 1. Flow imaging microscopy and light obscuration specifications. Source: Yokogawa Fluid Imaging Technologies, Inc.
| Method |
Flow Imaging Microscopy (FIM) |
Light Obscuration (LO) |
| Measurement Principle |
A camera captures light microscopy images of a sample as it is drawn through a flow cell. Those images are processed to isolate images of individual particles, yielding a particle count measurement. Particle images can be further analyzed to determine particle size and other morphology features (e.g. aspect ratio, circularity). |
A sample is drawn through a microfluidics channel between a laser and a photodiode. Particles in the sample block a fraction of the light that reaches the diode, generating an electric signal proportional to the particle size. The signals are then used to count and size particles. |
| Measures Particle Count |
Yes |
Yes |
| Measures Particle Size |
Yes |
Yes |
| Measures Particle Morphology |
Yes |
No |
| Size Range |
2 - 100 μm |
2 - 100 μm |
| Throughput |
0.2 mL/min |
10 mL/min |
| Minimum Sample Volume |
100 μL |
100 μL |
| Maximum Particle Concentration |
~1,000,000 particles/mL |
~30,000 particles/mL |
| Translucent Particle Sensitivity |
High |
Standard |
| Reveals Particle Types |
Yes (e.g. air bubbles, silicone oil) |
No |
| Sample Introduction |
Transfer sample via pipette |
Place inlet line in sample |
| Compatible with Automation |
Yes (automated liquid handling) |
No |
| Compendial Sizing Technique |
No |
Yes (USP <787> and USP <788>) |
| USP-Recommended subvisible particle analysis method |
Yes (via USP <1788>) |
Yes (via USP <787> and USP <788>) |
FIM also enables researchers to record information on the shape and morphology of particles in their samples, allowing them to detect particle kinds and origins, as well as the presence of typical artifacts such as air bubbles10-12—information that LO data cannot provide.
LO data is useful as a well-established method for counting and sizing particles. The data LO collects may be compared not only to the compendial restrictions but also to the vast amount of historical data available through this technology.
Combining FIM with LO provides a relevant representation of a sample's subvisible particle composition for lot release applications, as indicated in USP <1788>.13
FlowCam LO greatly simplifies the process of collecting FIM and LO data for samples.14 This instrument combines an FIM module configured for subvisible particle analysis and a light obscuration module, allowing researchers to collect results from both approaches on a single instrument using a single aliquot of sample.
Figure 3 depicts a schematic of FlowCam LO's dual-technique architecture, which not only saves samples and time but also enables users to immediately compare particle readings from the two modalities to confirm their conclusions.
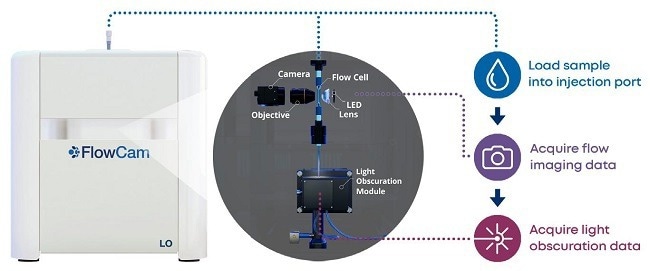
Figure 3. FlowCam LO schematic. The instrument performs flow imaging microscopy first, then light obscuration measurements with the light obscuration module. Image Credit: Yokogawa Fluid Imaging Technologies, Inc.
To demonstrate the advantages of combining FIM with LO, Figure 4 displays sample particle size distributions and FIM pictures from FlowCam LO acquired from samples containing bovine serum albumin (BSA) and/or polysorbate 80 (PS80) treated to shaking or heating stress.15
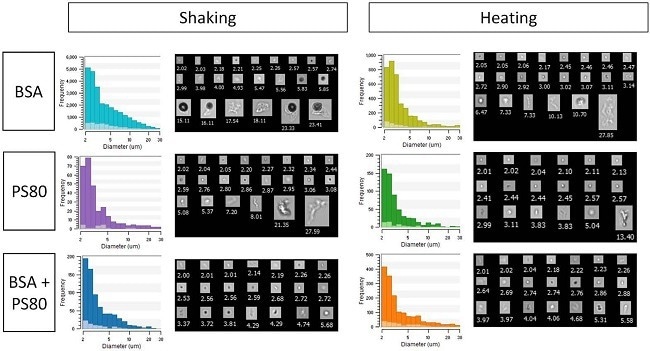
Figure 4. FlowCam LO-measured particle size distributions (histograms) and FIM images (collages) for stressed samples containing protein (BSA), surfactant (PS80), or both. Dark histogram bars indicate FIM data, light bars indicate LO data. Image Credit: Yokogawa Fluid Imaging Technologies, Inc.
Table 2 displays the particle concentrations for each sample and procedure, including concentrations greater than 10 and 25 µm.
Table 2. Particle concentrations measured by FIM and LO for the samples in Figure 4. Source: Yokogawa Fluid Imaging Technologies, Inc.
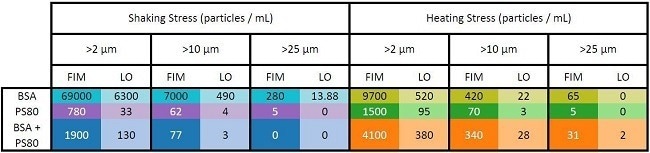
The FIM results (Figure 4 and Table 2, dark color bars and table entries) showed that shaking stress produced more protein aggregates than heating stress when applied to samples containing solely protein. These results also indicate that polysorbate protected the protein more effectively against shaking stress than heating stress.
The LO results for these samples (Figure 4 and Table 2, light color bars and table entries) consistently showed lower particle concentrations than those obtained with FIM.
Because both tests were performed on the same sample aliquots, the discrepancies are mostly due to bias produced by particle transparency.
Despite these discrepancies, the LO data reveals the same patterns as the FIM data and validates the results reached using the FIM data alone. Because both measurements were obtained using FlowCam LO, this validation using an orthogonal approach required no extra sample volume or apparatus.
Membrane microscopy
Membrane microscopy, the other often used technology for subvisible particle monitoring, 6,7 removes the formulation buffer from a sample before capturing pictures of the dry particles.
The elimination of the background fluid is the primary strength and weakness of this method and its current variants. Removing the fluid allows the user to detect particles with the same refractive index as the background material.
However, this filtration can remove significant particle types such as silicone oil, and may cause particle aggregation and shape changes during filtering.
Membrane microscopy also needs an operator to manually count and size particles using a microscope, which introduces human bias and high operator-to-operator variability while lowering analytical throughput.
Contamination is also more difficult than FIM and LO since the measurements are taken outside of a confined fluidic element and, as a result, must frequently be done under laminar flow.
While particle changes with filtering and other constraints are troublesome, membrane microscopy and its derivatives give extra visible particle information when employed as an orthogonal assessment of particle count, size, and morphology in conjunction with FIM.
In exchange, FIM offers automated measurement of subvisible particles in their natural solvent.
Laser diffraction
This approach employs light scattering as particles travel through a laser beam to calculate particle size using a scattering model.
While these measures have a broad size range and a high throughput, they necessitate large sample volumes and sample recirculation and can be difficult to conduct on samples with low particle concentrations.
Laser diffraction also needs an understanding of the sample's refractive index and the assumption that the particles are spherical. If a large enough sample volume is available, laser diffraction can offer a quick, orthogonal assessment of subvisible particle size to FIM while simultaneously collecting submicron and visible particles.
In contrast, FIM has flexible volume and concentration limitations, does not need recirculation, and is capable of examining particles of any shape—information obtained from the particle pictures captured by FIM.
Electrical sensing zone
The electrical sensing zone, often known as the Coulter principle, counts and sizes particles in samples by passing them between two electrodes and monitoring the electrical field disturbance that results.
Unlike many of the other approaches discussed here, this method is not optical and so unaffected by particle translucency. However, it has limitations on the minimum formulation buffer conductivity and may necessitate dilution or buffer exchange to function, thereby altering the quantity, size, and type of particles in the sample.
FIM measurements are unaffected by buffer conductivity and frequently do not need dilution. By combining an electrical sensing zone with FIM to define particle count and size, researchers may investigate transparent particles that flow imaging may miss while simultaneously collecting particle information in the native solvent.
Electron microscopy (EM)
Electron microscopy (EM) methods investigate materials using electrons rather than light sources, producing high-resolution pictures of subvisible, submicron, and even nanometer-sized particles.
The primary disadvantage of this higher resolution is that it necessitates more involved sample preparation and a longer total analysis time, resulting in poorer throughput and perhaps altered particle shape.
This analysis also has high training requirements and may necessitate the employment of an EM-specialized technician, making it impractical for normal application.
EM may be employed as an orthogonal approach of subvisible particle size and morphological characterization, collecting tiny particle structural information that is difficult to get in a light microscopy-based method, but only on a much smaller sample volume and frequently on a limited number of samples.
In exchange, FIM measures particles in their natural solvent and, because of its high throughput and ease of use, allows for greater flexibility in the number of samples and volume per sample evaluated.
Complementary strategies to explore alongside FIM will frequently be determined by the treatment being used and the questions being asked.
For example, a researcher interested in characterizing a protein and its aggregates in a drug product may benefit from combining FIM with techniques to monitor particle aggregation in other size ranges such as visible particles (e.g., visual inspection), submicron particles and nanoparticles (e.g., dynamic light scattering), and protein oligomers (e.g., size exclusion chromatography).2,16
Circular dichroism, Fourier transform infrared spectroscopy, and fluorescence spectroscopy are all useful techniques for analyzing protein structure.
Other biotherapeutics may necessitate different techniques for monitoring CQAs relevant to that drug product (e.g., analytical ultracentrifugation to measure AAV full/empty ratio).2 Following are two complementary techniques that will be useful in many of the same applications as FIM where particle content is of interest.
Dynamic light scattering (DLS)
DLS, one of the most widely used analytical methods, is an effective method for monitoring nanoparticles, submicron particles, and tiny subvisible particles near and below the lower size range of optical techniques such as FIM.
Particles in this size range are of interest in many of the same biotherapeutic stability and formulation research that flow imaging supports, as many API monomers can be detected using DLS but not FIM.
Flow imaging, in turn, records particle size for bigger subvisible particles, which might bias DLS results. Combining these data enables researchers to track the aggregation of proteins, viral vectors and virus-like particles, lipid nanoparticles, and other nanomedicine APIs throughout a wide range of sizes, from nanometers to hundreds of micrometers.
Extended size range FIM
FlowCam equipment may also be used with different objective lenses to alter the size range, resulting in self-complementary FIM particle data.
FlowCam systems typically employ 10X and 20X objective lenses to detect particles as small as 2-100 µm.
On FlowCam 8000 series instruments, the objective may be replaced with a lower power 4X objective lens, extending the size range to 15-600 µm. This translates FIM into a tool for monitoring visible particles and "gray zone" particles between visible and subvisible—an application that researchers have begun to investigate.17
FlowCam Nano's 40X magnification lens enables researchers to photograph and analyze submicron particles ranging from 0.3-2 µm in size, which are difficult to identify using current approaches.
While the approach is the same, these variants modify the particle size range that FlowCam may assess, making them supplementary to more typical FIM measurements.
Summary
When creating and producing biotherapeutics, orthogonal and complementary analytical methods are critical for gaining a comprehensive, accurate description of a biotherapeutic sample and answering research questions.
FlowCam equipment gives subvisible particle count, size, and morphology data that are useful in a variety of applications, either as an orthogonal technique to other subvisible particle investigations or as a supplement to other biophysical techniques.
References
- Corvari V, Narhi LO, Spitznagel TM, et al. Subvisible (2-100 μm) particle analysis during biotherapeutic drug product development: Part 2, experience with the application of subvisible particle analysis. Biologicals. 2015;43(6):457-473. doi:10.1016/j.biologicals.2015.07.011
- Roesch A, Zölls S, Stadler D, et al. Particles in Biopharmaceutical Formulations, Part 2: An Update on Analytical Techniques and Applications for Therapeutic Proteins, Viruses, Vaccines and Cells. J Pharm Sci. 2021;000. doi:10.1016/j.xphs.2021.12.011
- Simon CG, Borgos SE, Calzolai L, et al. Orthogonal and complementary measurements of properties of drug products containing nanomaterials. Journal of Controlled Release. 2023;354:120-127. doi:10.1016/j. jconrel.2022.12.049
- Carpenter JF, Randolph TW, Jiskoot W, et al. Overlooking Subvisible Particles in Therapeutic Protein Products: Gaps That May Compromise Product Quality. J Pharm Sci. 2009;98:1201-1205. doi:10.1002/jps
- Ripple DC, Hu Z. Correcting the Relative Bias of Light Obscuration and Flow Imaging Particle Counters. Pharm Res. 2016;33(3):653-672. doi:10.1007/ s11095-015-1817-9
- United States Pharmacopeia. USP Subvisible Particulate Matter in Therapeutic Protein Injections.
- United States Pharmacopeia. USP Particulate Matter in injections.
- Zölls S, Gregoritza M, Tantipolphan R, et al. How Subvisible Particles Become Invisible — Relevance of the Refractive Index for Protein Particle Analysis. Pharm Biotechnol. 2013;102(5):1434-1446. doi:10.1002/jps
- Shibata H, Harazono A, Kiyoshi M, Ishii-Watabe A. Quantitative Evaluation of Insoluble Particulate Matters in Therapeutic Protein Injections Using Light Obscuration and Flow Imaging Methods. J Pharm Sci. 2021;000. doi:10.1016/j.xphs.2021.09.047
- Strehl R, Rombach-Riegraf V, Diez M, et al. Discrimination between silicone oil droplets and protein aggregates in biopharmaceuticals: A novel multiparametric image filter for sub-visible particles in microflow imaging analysis. Pharm Res. 2012;29(2):594-602. doi:10.1007/s11095-011-0590-7
- Calderon CP, Daniels AL, Randolph TW. Deep Convolutional Neural Network Analysis of Flow Imaging Microscopy Data to Classify Subvisible Particles in Protein Formulations. J Pharm Sci. 2018;107(4):999-1008. doi:10.1016/j.xphs.2017.12.008
- Shibata H, Terabe M, Shibano Y, et al. A Collaborative Study on the Classification of Silicone Oil Droplets and Protein Particles Using Flow Imaging Method. J Pharm Sci. 2022;111(10):2745-2757. doi:10.1016/j. xphs.2022.07.006
- United States Pharmacopeia. USP Methods for the Determination of Subvisible Particulate Matter.
- Yokogawa Fluid Imaging Technologies. Measuring Subvisible Particles and Aggregates using FlowCam LO [White Paper]. Published online 2021. https://info.fluidimaging.com/flowcam-lo-white-paper-download
- Yokogawa Fluid Imaging Technologes. Characterizing Protein Aggregates with Orthogonal and Complementary Analytical Techniques [White Paper]. Published online 2022. https://info.fluidimaging.com/download-orthogonal-and-complementary-techniques
- Narhi LO, Corvari V, Ripple DC, et al. Subvisible (2-100 μm) particle analysis during biotherapeutic drug product development: Part 1, considerations and strategy. J Pharm Sci. 2015;104(6):1899-1908. doi:10.1002/jps.24437
- Telikepalli SN, Carrier MJ, Ripple DC, et al. An Interlaboratory Study to Identify Potential Visible Protein-Like Particle Standards. AAPS PharmSciTech. 2023;24(1). doi:10.1208/s12249-022-02457-9
About Yokogawa Fluid Imaging Technologies, Inc.

At Yokogawa Fluid Imaging Technologies our mission is to bring clarity and focus to the study of subvisible particles in the life sciences. With our FlowCam technology, we are committed to developing innovative hardware and software to monitor Earth’s water bodies and drinking water supply for hazardous algae, to help make vaccines and injectable medicines safer, and to improve product quality in a variety of applications.
FlowCam instruments combine the benefits of digital imaging, flow cytometry, and microscopy into a single solution - Flow Imaging Microscopy (FIM). Beyond traditional particle sizing and counting, FIM's image-based analysis allows for comprehensive characterization of subvisible API aggregates and contaminants in biopharmaceuticals, mammalian cells, microplankton, emulsions, and advanced materials. FlowCam instruments have been deployed in over 50 countries, supporting research, development, and environmental monitoring in the life sciences, materials research, and industrial applications.
Sponsored Content Policy: News-Medical.net publishes articles and related content that may be derived from sources where we have existing commercial relationships, provided such content adds value to the core editorial ethos of News-Medical.Net which is to educate and inform site visitors interested in medical research, science, medical devices and treatments.