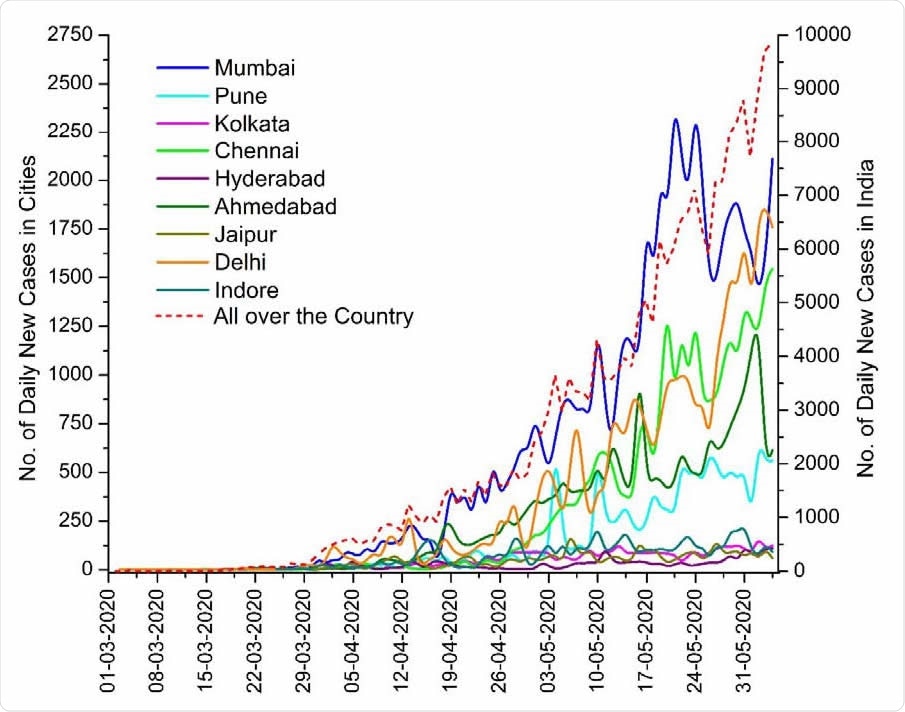
With India now having endured six months of the severe acute respiratory syndrome coronavirus 2 (SARS-CoV-2) pandemic, there are now over 410,000 official cases in and more than 13,000 deaths recorded. Almost all these deaths have occurred in the last three months, April to June, with 100 deaths on April 4, 2020, increasing almost 16-fold by May 4, and 63-fold by June 4, 2020.

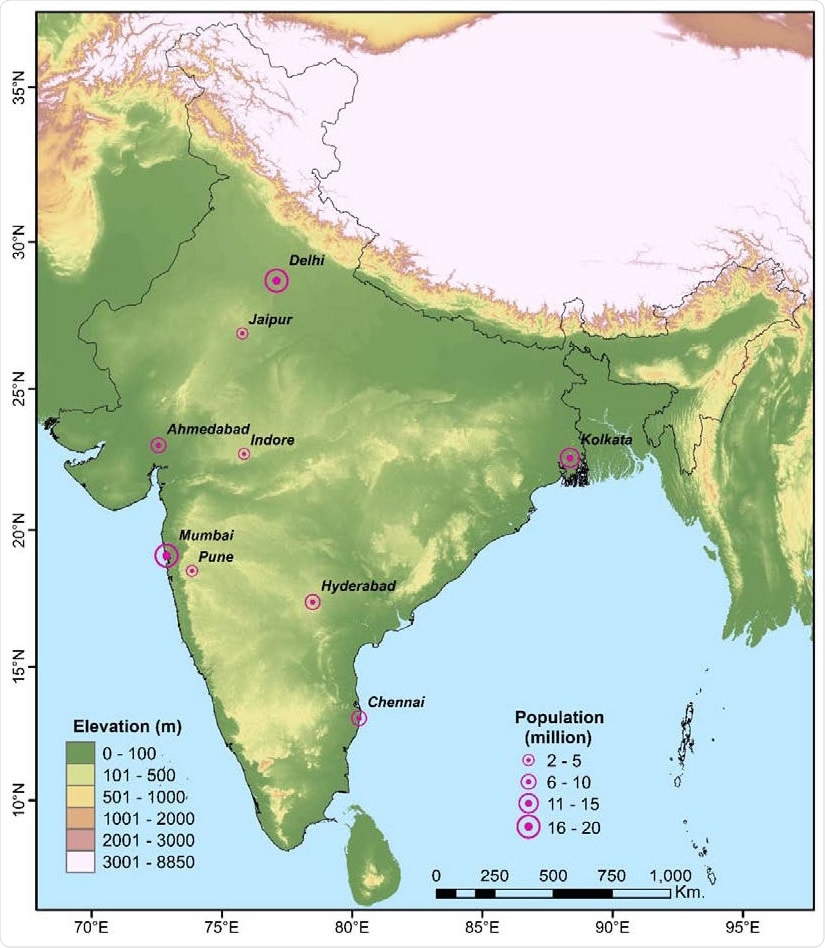
Location of the selected cities in India along with the total population of those cities.

 This news article was a review of a preliminary scientific report that had not undergone peer-review at the time of publication. Since its initial publication, the scientific report has now been peer reviewed and accepted for publication in a Scientific Journal. Links to the preliminary and peer-reviewed reports are available in the Sources section at the bottom of this article. View Sources
Impact of Environmental Factors on Viral Spread
Environmental factors, including humidity, temperature, and climate, have been studied by many researchers in an attempt to find out what fuels the rapid transmission of the virus. Some studies show that these are related to different rates of spread.
With earlier influenza outbreaks, the air temperature has been shown to affect the epidemic parameters, mostly within tropical regions. Still, in the temperate zones, influenza hits mostly in the winter months. Even though some researchers deny such a correlation, others have predicted a fall in transmission with rising temperatures, in India. The latter scientists have also predicted a higher impact of the disease in relatively hotter areas.
Another area of research is the possible variation in the incubation period among different regions of the world. While the World Health Organization (WHO) reports an incubation period of 2-10 days worldwide, others have estimated it as being 10-14 days or even 2-14 days. Still, other groups report the incubation period to be about 20 days.
Daily Weather and Incidence, with Time-Lagged Correlation
The current study aims to understand the impact of daily weather on SARS-CoV-2 spread within India, and its incubation period. The researchers examined five time-frames, the first being on day zero, and then day 7, 10, 12, 14, and 16 days of disease.
The team analyzed data from 9 cities in India, all with populations of over a million, from which almost 80% of the total cases in India have been reported. The weather conditions were collected in terms of Maximum, Minimum and Mean Temperature, Diurnal Range in Temperature, Dew Point Temperature, Average Relative Humidity, Diurnal Range in Relative Humidity and Wind Speed.

Trend of daily confirmed cases over selected cities and all-over the country.
Temperature Factors and Viral Transmission
Using correlation techniques and a machine learning platform called a support vector machine (SVM), the researchers found first that there were significant but low-level correlations between the daily weather and daily incidence. They found a significant negative correlation between the average humidity on the day of transmission and daily incidence up to the tenth preceding day of transmission, but for the diurnal range of humidity, up to 12-16 days before. This suggests the need to learn more about the contribution of humidity to viral spread.
Most temperature parameters except the diurnal range of temperature are least well correlated on the day of transmission and highest on the 14th day before transmission, with the best correlation being found with the minimum temperature. In other words, the scientists say, “Places with higher minimum temperature are more susceptible for COVID-19 transmission in India.”
Wind speed is also positively correlated, perhaps because the wind carries the viral particles farther. The researchers feel that with the correlation of most weather factors with the daily count of confirmed cases at a time lag of 14 days, the incubation period is probably approximately 14 days in India.
When coupled with the SVM analysis, the time lag of 12+ days offers a strong correlation with daily confirmed cases, which means the incubation period in the Indian setting would probably be 12-16 days. However, there is a range of weather parameters related to a high susceptibility for viral spread.
Range of Variation
That is, about 80% of confirmed cases were recorded within a limited temperature and wind speed range occurring 12-16 days before the case report. These limits are:
- Temperature maximum - 33.6-41.3° C,
- Temperature mean - 29.8-36.5° C,
- Temperature minimum - 24.8-30.4° C,
- Temperature range - 7.5-15.2° C,
- Dew point temperature - 18.7-23.6° C,
- Wind speed - 4.2-5.75 m/s
Areas falling within this combination of parameters would thus have been most vulnerable to such spread. The advantage of using SVM is evident in that it clarified the association between the temperature variables with the daily transmission. The study reveals that densely inhabited areas in India had higher transmission during hot summer days, as shown by the positive correlation between the daily transmission, air temperature, and wind speed.
The incubation period quite clearly appears to be 12-16 days, which implies that with the prevailing weather conditions of the study period, the virus could continue to spread for two weeks after being acquired. Thus, despite the inability to incorporate data from all major cities with high transmission rates, and the exclusion of migrants who were quarantined with the disease, the study shows that “coronavirus transmission can’t be well linearly correlated with any single weather parameters, rather multivariate non-linear approach must be employed.” This approach has yielded excellent associations, and the use of time lags of up to 14 days shows the incubation period to be 14 days, on average, in India.

 This news article was a review of a preliminary scientific report that had not undergone peer-review at the time of publication. Since its initial publication, the scientific report has now been peer reviewed and accepted for publication in a Scientific Journal. Links to the preliminary and peer-reviewed reports are available in the Sources section at the bottom of this article. View Sources