The COVID-19 pandemic has been rampant for over six months, causing over 12.8 million cases and over 568,000 deaths. Caused by the severe acute respiratory syndrome coronavirus 2 (SARS-CoV-2), it has stimulated intense research to pinpoint its risk factors and modes of spread. This would significantly improve the management of patients at all stages. However, the lack of adequate data and the speed with which the disease is spreading has made the process difficult.
The Study: the CMR Tool's Performance
The current study presents the COVID-19 Mortality Risk (CMR) tool, which is a new machine learning model meant to predict the death rate in hospitalized patients with COVID-19. This would help deliver care to patients in a system where the resources are limited by enabling individualized risk scoring. The data is taken from many centers in the US and Europe and includes demographics, laboratory results, and coexisting illnesses.
The researchers used the XGBoost algorithm, which is a machine ensemble learning method that can be used to predict probability. CERN recognized it as the best approach to classify signals from the Large Hadron Collider. The ability of XGBoost to capture nonlinear risk factors leads to robust predictive performance. The researchers also found that the commonly accepted risk factors like age and poor lung oxygenation were indeed associated with a high risk.
The study first considered an international cohort admitted across three hospitals in Spain, Italy, and the US. The cohort was then tested for validity on hospitalized patients in a six-hospital group based in Greece, Spain, and the US. This would ensure that both the patient profiles and the mortality rates are widely varied.

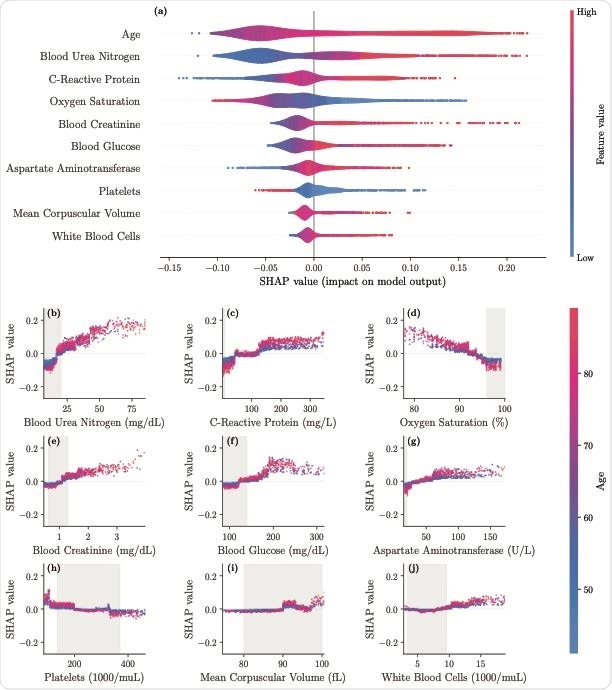
SHAP importance plots for the final model. The top 10 features are displayed in panel a, ordered by decreasing significance. For a given feature, the corresponding row indicates the SHAP values as the feature ranges from its lowest (blue) to the highest (red) value. Panel b-j display the individual feature plots and the impact of each feature on the mortality risk (colors indicate the age here) with gray areas indicating reference ranges

 This news article was a review of a preliminary scientific report that had not undergone peer-review at the time of publication. Since its initial publication, the scientific report has now been peer reviewed and accepted for publication in a Scientific Journal. Links to the preliminary and peer-reviewed reports are available in the Sources section at the bottom of this article. View Sources
Optimizing model efficiency
The current model is an advance on an earlier model proposed by Pourhomayoun et al. (2020), which was not comprehensive in the scope of the patient data. In this study the final population was over 3,000 patients, with an observed death percentage of about 27%. The casualties tend to be older, at 80 vs. 64 for survivors, and 67% are men, though they make up 58% of the cohort. Illnesses like cardiac arrhythmias, chronic renal disease, and diabetes are more frequent in the non-survivors.
The model performs best when the baseline mortality is not very low when the accuracy and specificity is 87%. The study identified the most important risk factors for mortality as high blood urea > 20 mg/dL, a C-reactive protein (CRP) above 160 mg/L, and oxygen saturation below 93%, especially with increasing age. Blood creatinine levels above 1.2 mg/dL also increase the mortality risk. Blood glucose levels above 180 mg/dL is a risk factor, particularly in older patients, as well as aspartate aminotransferase (AST) more than 65 U/L.
The platelet count affects the risk differently in different age groups. A platelet count below 50 x 103/μL increases the risk, but less so between 50 and 180 x 103/μL.
Implications and Conclusions
The CMR calculator presented here allows mortality to be predicted based on early clinical features and measures. This allows efficient segregation of patients so as to optimize the use of scarce resources. This is particularly helpful when the center is not well-equipped for diagnostic testing.
The study found that age is the prime factor in determining the risk of death, while other factors include low oxygen saturation. This is also useful to pick up respiratory distress and respiratory failure. Factors in laboratory testing outcomes include blood urea, creatinine, glucose, AST, and platelet counts. These can be biomarkers as well, and help to pick up severe community-acquired pneumonia.
CRP is a widespread biomarker of inflammation, but beyond 50 mg/L, it has first a slight effect, and beyond 130 mg/L, it causes a sizable increase in mortality. Both urea and creatinine elevations indicate severe systemic disease associated with reduced renal function, a marker of poor prognosis.
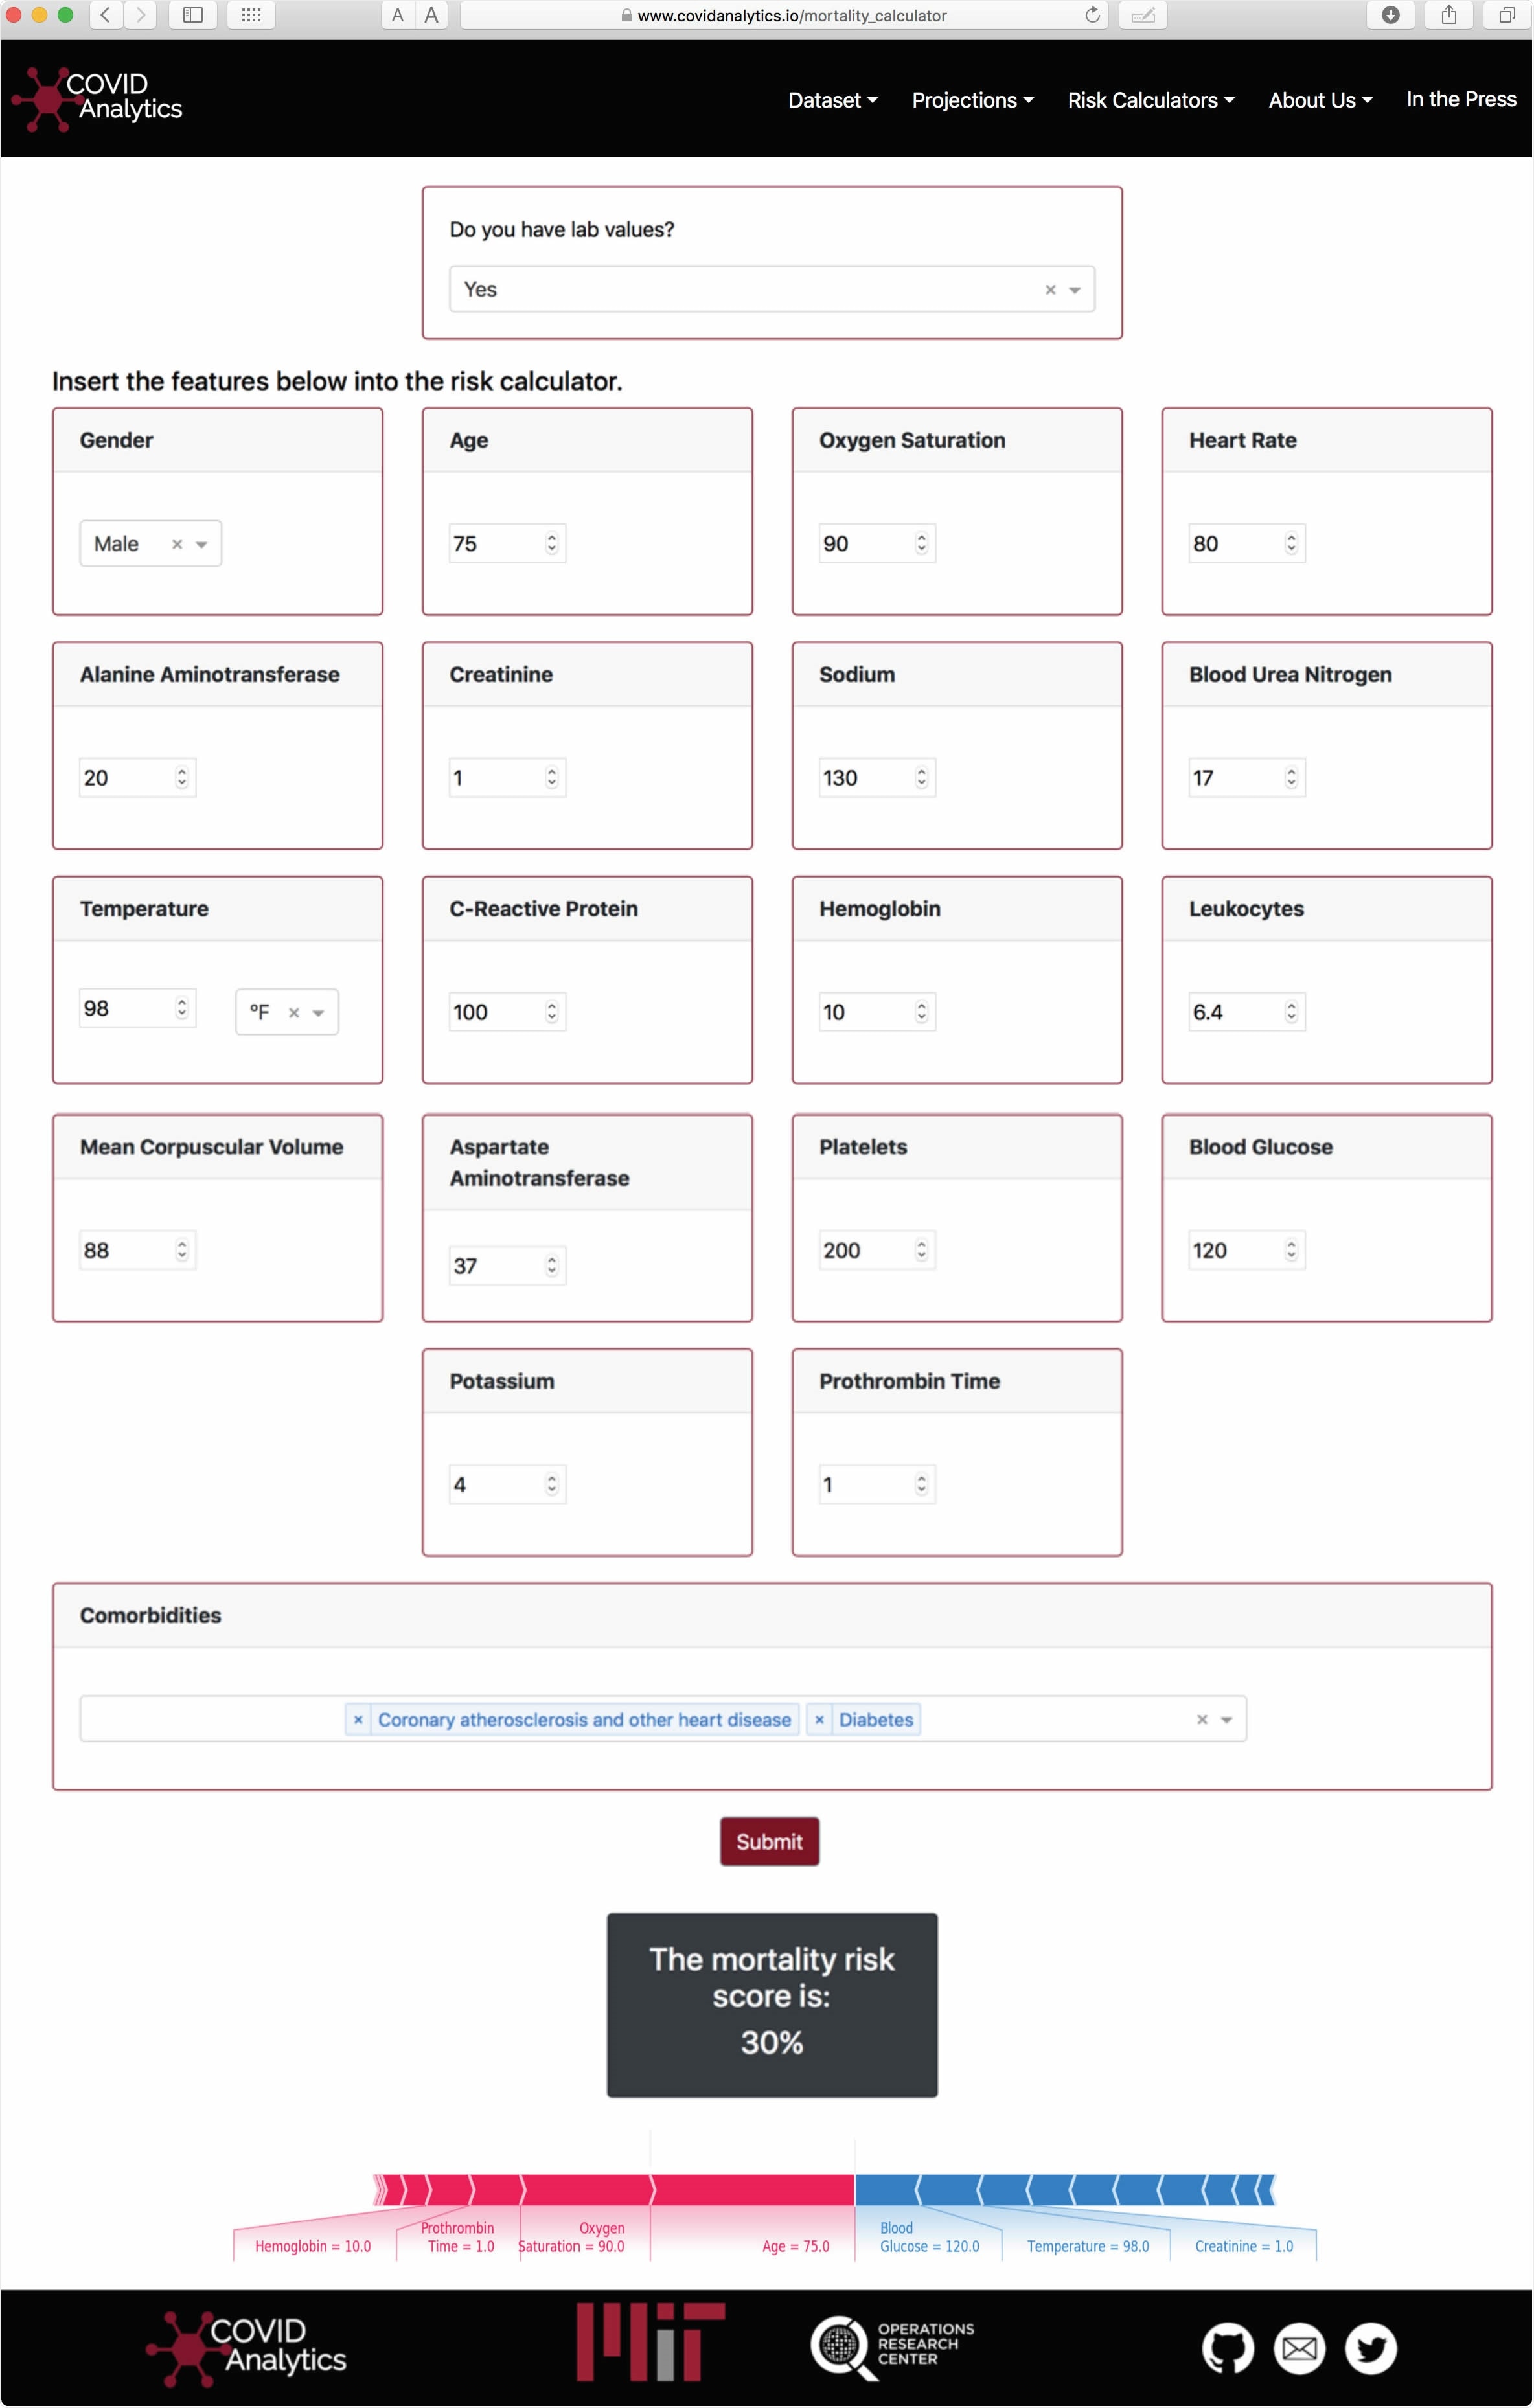
To apply the model to other hospitals, the threshold should be calibrated to the severity of that group, comparing it to a historical sample at the same place. The researchers also created an online application to allow it to be readily usable by clinicians.

Visualization of the Calculator interface. Using the SHAP package, personalized interpretations of the predicted score are provided to the user.
The study concludes, "This international study provides a mortality risk calculator of high accuracy for hospitalized patients with confirmed COVID-19. The CMR model validates several reported risk factors and offers insights through a user-friendly interface. Validation on external data shows strong generalization to unseen populations in both Europe and the United States and offers promise for adoption by clinicians as a support tool."
The tool could help healthcare professionals triage and treat their patients more rationally.

 This news article was a review of a preliminary scientific report that had not undergone peer-review at the time of publication. Since its initial publication, the scientific report has now been peer reviewed and accepted for publication in a Scientific Journal. Links to the preliminary and peer-reviewed reports are available in the Sources section at the bottom of this article. View Sources