Researchers from Duke university, Federal University of Paraiba, University of Sao Paulo and Oswaldo Cruz Foundation have looked at the association between the COVID-19 pandemic in Brazil and other factors, including the incidence of dengue fever in the region. Their study titled, “How super-spreader cities, highways, hospital bed availability, and dengue fever influenced the COVID-19 epidemic in Brazil,” was released pre-peer review on the preprint medRxiv* early this week.
Severe acute respiratory syndrome coronavirus 2 (SARS-CoV-2 has gripped the world in a deadly pandemic that began the end of last year and, to date, has infected over 32 million individuals. Brazil stands third in the total number of COVID-19 cases at over 4.6 million. The first reported case in the country was on February 26, 2020.
Since the declaration of the pandemic in March 2020, international airports have been closed in the country to prevent the entry of the infected persons and spread of the disease. Despite this, there has been an uneven geographical spread of the infection around the country, write the researchers. The cause behind this uneven distribution of cases and rates of deaths in different parts of the country is not known.
The researchers wrote, “...the routes taken by SARS-CoV-2 to reach the entire Brazilian territory remained mysterious until now”. The country has five official regions, “North (NO), Northeast (NE), Central-West (CO), Southeast (SE) and South (S).” Cases and deaths were unevenly distributed across these regions, they wrote. There were differences in the incidence of new cases, rate of growth or spread, date of arrival of the new cases from abroad, and rate of deaths. These were studied over the first six months of the pandemic in Brazil in this study.

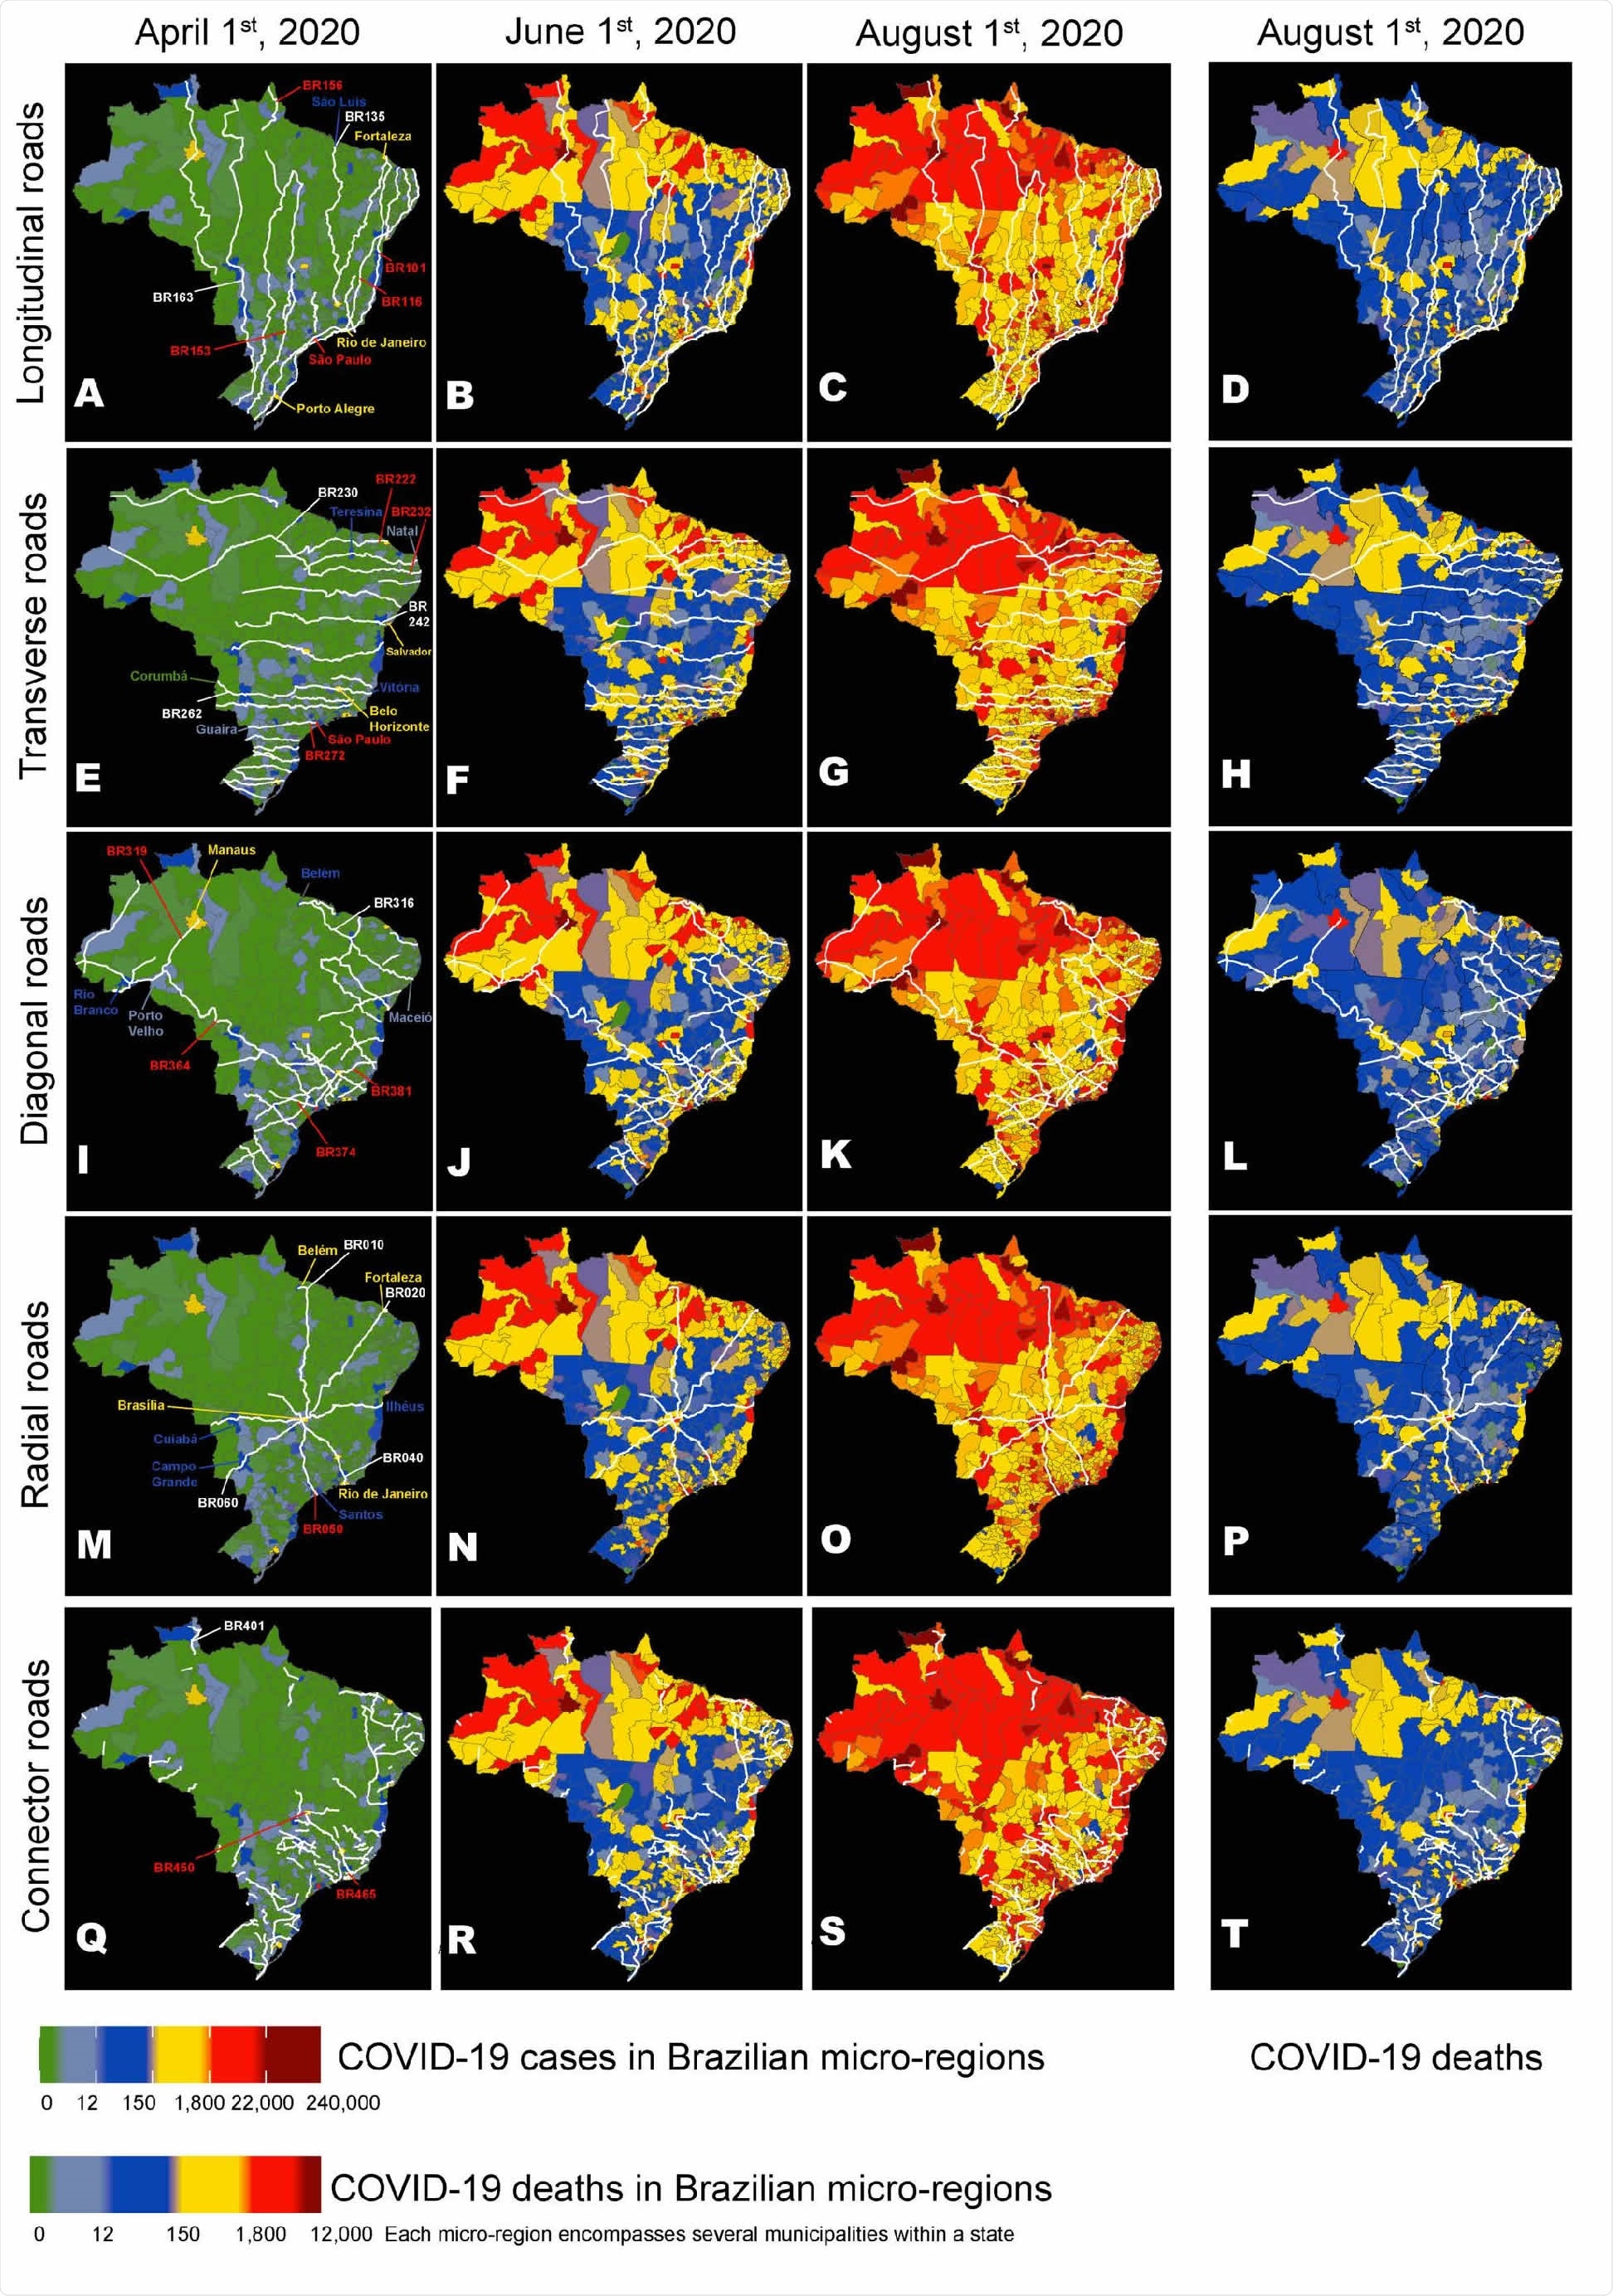
Maps of Brazil were used to represent the routes of the main longitudinal (AD), transversal (E- H), diagonal (I-L), radial (M-P), and connector (Q-T) federal highways, as well as the evolution of the geographic distribution of COVID-19 cases on three dates (April 1st, June 1st, and August 1st), and the distribution of COVID-19 deaths on August 1st (D). Overall, a group of 26 highways (see text) from all five road categories contributed to approximately 30% of the COVID-19 case spreading throughout Brazil. The numbers of some of these spreading highways are highlighted in red. Notice how many hotspots (red color) for COVID-19 cases occur in micro-regions containing cities that are located along major highway routes like BRs 101, 116, 222, 232, 236, 272, 364, 374, 381, 010, 050, 060, 450, and 465. Although the distributions for COVID-19 cases and deaths were correlated, geographic discrepancies between the two distributions can be clearly seen by comparing them on August 1st (C and D). A color code (See Figure bottom) ranks Brazilian micro-regions (each comprising several tows) according to their number of COVID-19 cases and deaths.

 This news article was a review of a preliminary scientific report that had not undergone peer-review at the time of publication. Since its initial publication, the scientific report has now been peer reviewed and accepted for publication in a Scientific Journal. Links to the preliminary and peer-reviewed reports are available in the Sources section at the bottom of this article. View Sources
What was found?
The results of this study showed that there were four significant factors associated with the uneven distribution of COVID-19 cases in Brazil. This was found using mathematical modeling. Some of the highlights of the findings were;
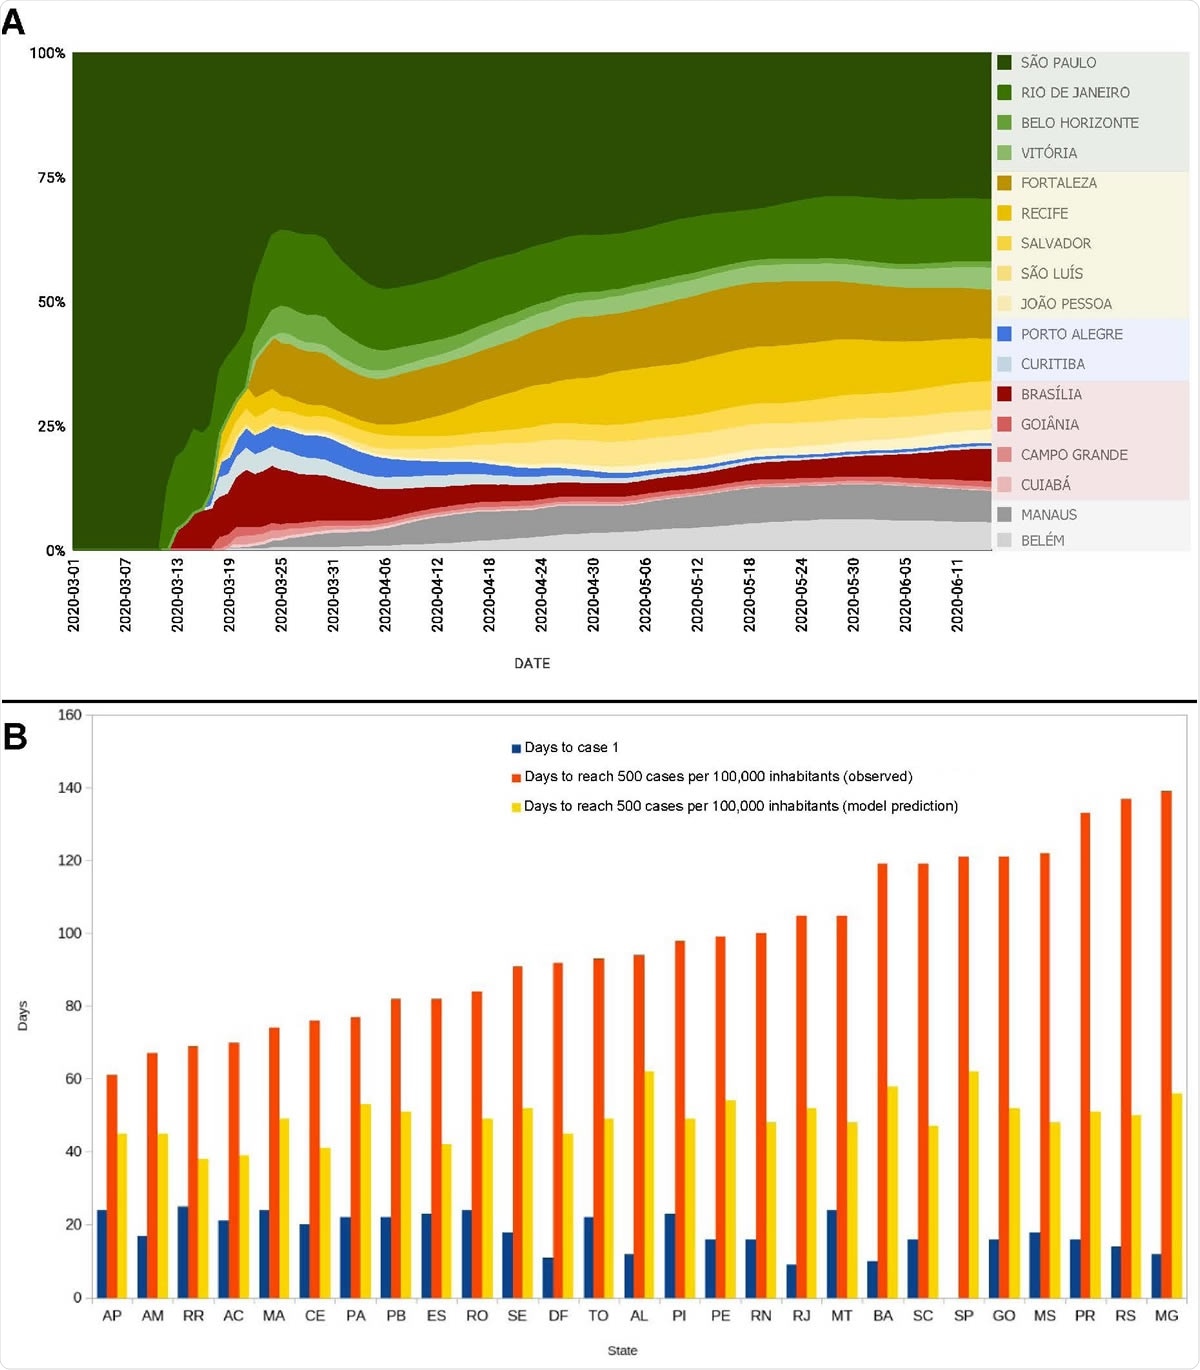
- Super spreader areas included the city of São Paulo where there were 80 percent of all cases in the country
- 16 cities accounted for 98 to 99 percent of all cases in the first 3 months of the pandemic.
- 26 major highways were responsible for 30 percent of the spread of COVID-19 cases
- Cases rose in the countryside. However, due to lack of ICU (Intensive care unit) beds in the countryside, the severely ill cases had to be moved to cities where they succumbed to the infection. This led to a skewing of mortality rates in the cities, wrote the researchers. They called this the “boomerang effect.”
- There were 3.5 million cases of dengue fever between January 2019 and July 2020. Those regions where people had high antibody (IgM) levels for dengue fever had a low incidence of COVID-19 cases, and there was also a lower infection growth rate and mortality.
- The negative relation between COVID-19 was not seen with IgM data for the Chikungunya virus
- The team writes, “While dengue cases were more numerous in the NE, compared to the NO region, this region was dominated by cities with high COVID-19 and low dengue incidences...A larger number of cities with a high incidence of dengue, and very low COVID-19 incidence, occurred in the SE and SO regions.” There was a significantly low incidence of cases in Paraná, Santa Catarina, Rio Grande do Sul, Mato Grosso do Sul after the initial spike in March 2020.

(A) Individual contribution of the 17 state capital cities that were responsible for 98% of spreading of COVID-19 cases for the 5570 Brazilian municipalities, from March 1st to June 11th. Notice how São Paulo contributed to more than 80% of all case spreading during the first weeks of March. Throughout the period until June 11th, São Paulo’s contribution never decreased below 30%. For that reason, the city was labeled as the COVID-19 super-spreader Brazilian city. Notice also the high contribution of Rio de Janeiro, Brasilia, and five state capitals in the Northeast region: Fortaleza, Recife, Salvador, São Luís, and João Pessoa. Manaus and Belém were the largest spreading cities in the North (Amazon) region and Porto Alegre and Curitiba the most important in the South region. During this period, the contributions of Goiânia, Campo Grande and Cuibá, in the Central-West region were the largest in their region but much smaller when compared to other regions and their spreaders. (B) Bars represent the day the first COVID-19 case (blue bars) was officially reported in each state (using São Paulo’s first case on February 26th, 2020 as the 0 reference), the number of days estimated by a mathematical model for each state to reach 500 cases per 100,000 inhabitants (yellow bars), and the days in which each of Brazilian states actually reach the mark of 500 cases per 100,000 inhabitants (orange bars). Notice how much longer it took for states like MT, BA, SC, SP, GO, MS, PR, MG to reach the 500/100,000 milestone when compared to states like AP, AM, RR, AC, PA, and TO in the North region, MA, CE, PB, PI, SE, AL, and RN in the Northeast region, ES in the Southeast region, and DF in the Center-West region.
Implications of the findings
The team wrote, “This inverse correlation between COVID-19 and dengue fever was further observed in a sample of countries around Asia and Latin America, as well as in islands in the Pacific and Indian Oceans”. They noted that there was a chance of “immunological cross-reactivity” between DENV serotypes (dengue antibodies) and SARS-CoV-2, a dengue infection or immunization with a dengue vaccine could be protective against SARS-CoV-2 until a safe and effective vaccine against SARS-CoV-2 becomes available.
Professor Miguel Nicolelis, the lead author of the study from Duke University, in his statement, said that the viruses could have a cross-reactivity, which could be explored. This was an unexpected finding from this study, he said.
The researchers speculated that there are other flaviviruses such as Zika and yellow fever that may have cross immunological interactions with SARS-CoV-2, which need to be explored. These could provide solutions to stop the rate of growth of the infection. They especially hope that the yellow fever vaccine could help prevent the spread of SARS-CoV-2 if it shows cross immunoreactivity. These speculations, however, would need clinical studies to be proven to be effective until a safe and effective vaccine against the virus is available.

 This news article was a review of a preliminary scientific report that had not undergone peer-review at the time of publication. Since its initial publication, the scientific report has now been peer reviewed and accepted for publication in a Scientific Journal. Links to the preliminary and peer-reviewed reports are available in the Sources section at the bottom of this article. View Sources
Journal references:
- Preliminary scientific report.
How super-spreader cities, highways, hospital bed availability, and dengue fever influenced the COVID-19 epidemic in Brazil Miguel A. L. Nicolelis, Rafael L. G. Raimundo, Pedro S. Peixoto, Cecilia Siliansky de Andreazzi medRxiv 2020.09.19.20197749; doi: https://doi.org/10.1101/2020.09.19.20197749, https://www.medrxiv.org/content/10.1101/2020.09.19.20197749v1
- Peer reviewed and published scientific report.
Nicolelis, Miguel A. L., Rafael L. G. Raimundo, Pedro S. Peixoto, and Cecilia S. Andreazzi. 2021. “The Impact of Super-Spreader Cities, Highways, and Intensive Care Availability in the Early Stages of the COVID-19 Epidemic in Brazil.” Scientific Reports 11 (1). https://doi.org/10.1038/s41598-021-92263-3. https://www.nature.com/articles/s41598-021-92263-3.