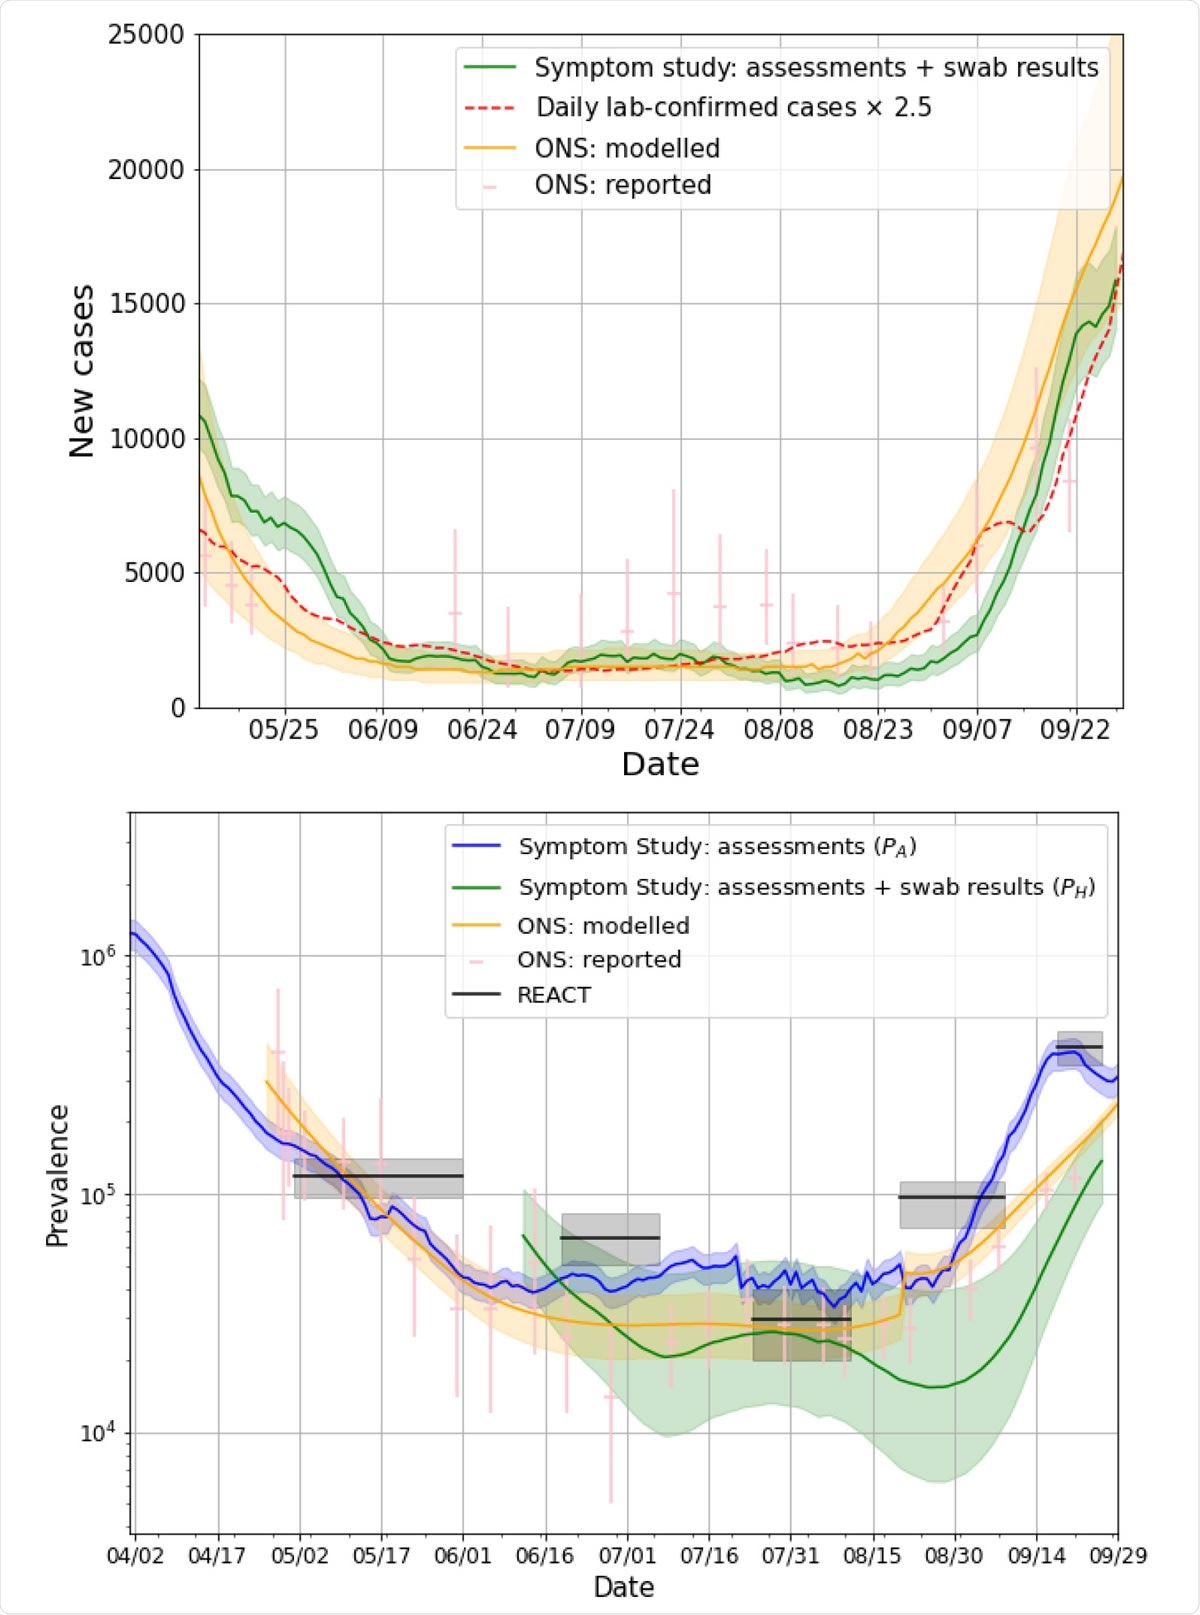
Researchers in the UK, United States, and Sweden have used large-scale self-reported app data to estimate coronavirus disease 2019 (COVID-19) incidence, prevalence, and effective reproductive number in England.
Using these geographical estimates, the team was able to highlight regions with rapidly increasing numbers of new cases or COVID-19 "hotspots."
The researchers were able to highlight these hotspots before they were even subjected to government lockdowns.
The team says policymakers could make use of this resource to implement highly localized mitigation interventions in these regions, thereby minimizing disruption to the rest of the country.
The researchers also say that to their knowledge, this study provides the first demonstration of a mobile technology enabling national-level disease surveillance.
"Our findings suggest that mobile technology can be used to provide real-time data on the national and local state of the pandemic, enabling policymakers to make informed decisions in a fast-moving pandemic," they write.
The study was conducted by Mark Graham (King's College London) and colleagues from Zoe Global Limited, UK, Massachusetts General Hospital; Uppsala University, Sweden, and Lund University Diabetes Center, Sweden.
A pre-print version of the paper is available on the server medRxiv*, while the article undergoes peer review.

Estimates of prevalence, including an estimate, obtained when all users who are sick upon sign-up are dropped from the analysis.
Avoiding repeats of lockdowns in the future
In many countries where the lockdown measures introduced to control COVID-19 have recently been lifted, governments are now seeking ways to reduce the risk of second waves that might call for these measures again.
Such strategies have so far included social distancing, mask-wearing, and the use of test-and-trace systems to detect new infections and prevent the risk of onwards transmission.
"Despite these efforts, many countries have experienced localized increases in infections since reopening," writes Graham and team.
Therefore, it has become a priority to track the incidence and prevalence of the causative agent severe acute respiratory syndrome coronavirus 2 (SARS-CoV-2) at a local level to pinpoint areas where targeted intervention is needed.
Although large-scale, population-based testing can home in on regional hotspots, it is at the cost of a delay between testing and actionable results.
Furthermore, to accurately identify changes in the infection rate, there needs to be sufficient testing coverage of a given population.
This can be expensive and also requires a significant testing capacity, say the researchers.
"There is a high unmet need for tools and methods that can facilitate the timely and cost-effective identification of infection hotspots to enable policymakers to act with minimal delay," they write.
What did the current study involve?
The researchers performed modeling of self-reported longitudinal, population-wide data obtained from users of the COVID Symptom Study app in England between March 24th and September 29th, 2020.
The team combined a symptom-based predictive model for COVID-19 positivity with RT-PCR (reverse-transcriptase polymerase chain reaction) test results that were also reported via the app.
More than 2.6 million app users completed a total of 115,268,569 daily reports of their symptoms.
Between April 28th and September 29th, more than 150,000 invitations for swab tests were sent out. Of these, 169,682 people reported their swab test result, of whom 1,912 were positive for SARS-CoV-2.
Using this data, the team was able to estimate disease incidence, prevalence, and effective reproduction number.
On a national level, the researchers say that their estimates of incidence and prevalence showed similar sensitivity to changes as two other community surveys that aimed to track national COVID-19 progression based on self-swabbing among communities.
These were the Office for National Statistics (ONS) survey and the Real-time Assessment of Community Transmission (REACT) study. Along with ONS and REACT datasets, the team also used government swab-test data to validate their models.
Estimates highlighted hotspots before they were subject to lockdown
Next, the team used the data to produce geographically granular estimates and generate a list of potential hotpots.
"Our estimates were able to highlight regions before they were subject to local government lockdowns," say the researchers.
The team's predictions, published online on July 23rd, correctly identified four out of nine hotspots that were subjected to a local lockdown by the UK government on July 30th.
Furthermore, between May 12th and September 29th, the researchers flagged between 35 and 80% of the regions that appeared in the government's hotspot list.
"We believe we are the first to provide national-level disease surveillance and find good agreement with traditional, representative community surveys," they write.
Such app-based systems could help to identify and monitor hotspots early on
Graham and colleagues believe the wide adoption of an app-based symptom surveillance system could help government and public health leaders identify areas of concern early and monitor targeted interventions' effects.
"Our findings suggest that mobile technology can be used to provide real-time data on the national and local state of the pandemic, enabling policymakers to make informed decisions in a fast-moving pandemic," concludes the team.