A team of scientists from the Icahn School of Medicine at Mount Sinai in the United States has developed a digital platform to identify severe acute respiratory syndrome coronavirus 2 (SARS-CoV-2) infection and related symptoms in healthcare personnel. They have measured heart rate variability using a novel Smartphone App installed in a commercial wearable device. The study is currently available on the medRxiv* preprint server.
Persistent transmission of deadly SARS-CoV-2, the causative agent for the coronavirus disease 2019 (COVID-19) pandemic, has already caused more than 50 million infections and more than 1.25 million deaths worldwide. Although the risk of developing severe complications is relatively high in susceptible individuals, such as older adults or people with comorbidities, about 30 – 45% of individuals with SARS-CoV-2 infection remain asymptomatic or mildly symptomatic. This further increases the viral spread as testing is mostly limited to symptomatic individuals.
In an effort to identify possible COVID-19 cases, many symptom tracking Smartphone Apps have been developed. However, these Apps generally rely on participants' adherence to the protocol and self-reported symptoms, which sometimes results in inaccurate predictions of cases. Similar to symptom tracking, various physiological parameters, such as heart rate, blood pressure, sleep pattern, and activity of the autonomic nervous system, can be objectively quantified using wearable remote sensing devices. Studies have shown that the accuracy of identifying possible COVID-19 cases can be improved by combining physiological measurements with the data obtained from symptom tracking Apps.
Heart rate variability (HRV) is one such parameter that provides important information about the crosstalk between parasympathetic and sympathetic nervous systems. This crosstalk plays a vital role in modulating cardiac contractility and beat-to-beat interval variability. A low HRV, which indicates enhanced sympathetic balance, is known to be a good predictor of infection state.
In the current study, the scientists utilized HRV data collected using a novel Smartphone App to identify and predict SARS-CoV-2 infection among healthcare personnel working throughout the Mount Sinai Health System in New York City.
Current study design
The scientists specifically aimed at determining if changes in HRV can predict the presence or development of COVID-19 symptoms. Moreover, they tried to evaluate the pattern of changes in HRV throughout the active disease period.
The remote enrollment of participants and the collection of HRV data were carried out using a Smartphone App (Warrior Watch App) installed in Apple watches. The participants were instructed to wear the watch for at least 8 hours/day. Various COVID-19 related symptoms, including fever, cough, sneezing, weakness, runny nose, breathlessness, headache, diarrhea, and loss of smell and taste, were collected daily using survey questionnaires. In addition, results of polymerase chain reaction (PCR)-based SARS-CoV-2 testing and serum anti- SARS-CoV-2 antibody testing were collected using survey questionnaires.

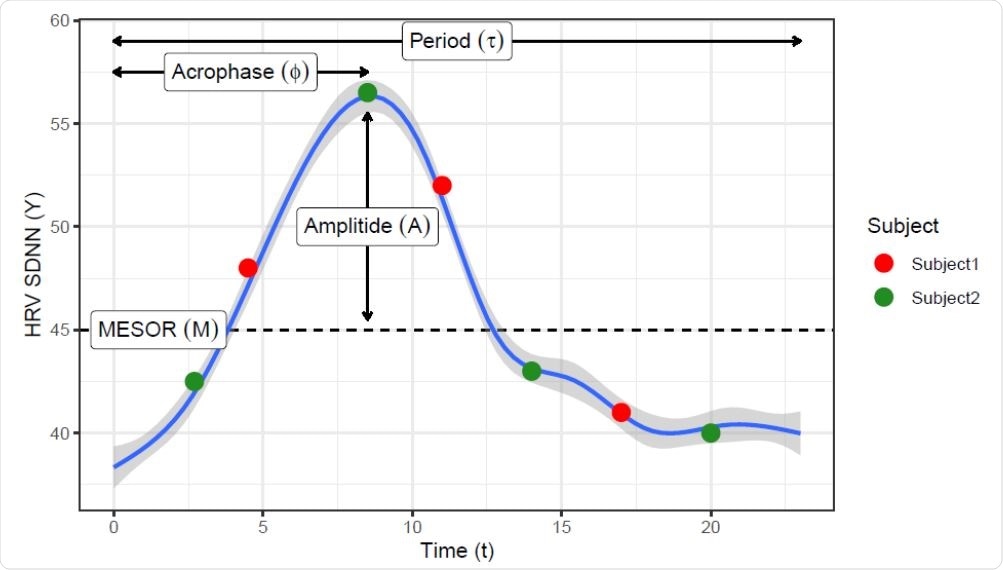
Locally estimated scatterplot smoothing (loess) curve showing a daily circadian pattern on HRV measures. Such pattern can be represented by the COSINOR model using 3 parameters: the rhythm-adjusted mean (MESOR), half the extent of variation within a day (Amplitude) and the time of overall high values recurring in each day (acrophase). Red and green dots represent hypothetical sampling times though the day from two subjects that have the same daily curve, showing that features like maximum, range, or CV will be easily biased by the sampling time.
Important observations
A total of 297 healthcare workers were evaluated during the study period. The median duration of the follow-up period was 42 days. During this period, 13 participants reported having a positive COVID-19 diagnosis.
Among various physiological parameters, the circadian pattern of HRV, especially the standard deviation of N-N interval (also called R-R interval), was found to differ significantly between participants with and without COVID-19. A significant variation in this parameter was also observed in participants from 7 days before to 7 days after the COVID-19 diagnosis. This indicates that changes in HRV can be considered as a good predictor of COVID-19. Interestingly, after 7 – 14 days of COVID-19 diagnosis, the circadian pattern of HRV tended to normalize, and no significant variation was observed between participants with and without COVID-19.
Regarding COVID-19 symptoms, significant changes in the circadian HRV patterns were observed on the first day of symptom onset compared to other follow-up days. Specifically, changes in the standard deviation of the N-N interval appeared to be more prominent on the day before symptom onset.
Taken together, the study findings suggest that changes in the circadian pattern of HRV can be used as a digitally-obtained physiological parameter to identify individuals with possible SARS-CoV-2 infection. This parameter can also be used to predict COVID-19 even before the onset of symptoms.

 This news article was a review of a preliminary scientific report that had not undergone peer-review at the time of publication. Since its initial publication, the scientific report has now been peer reviewed and accepted for publication in a Scientific Journal. Links to the preliminary and peer-reviewed reports are available in the Sources section at the bottom of this article. View Sources