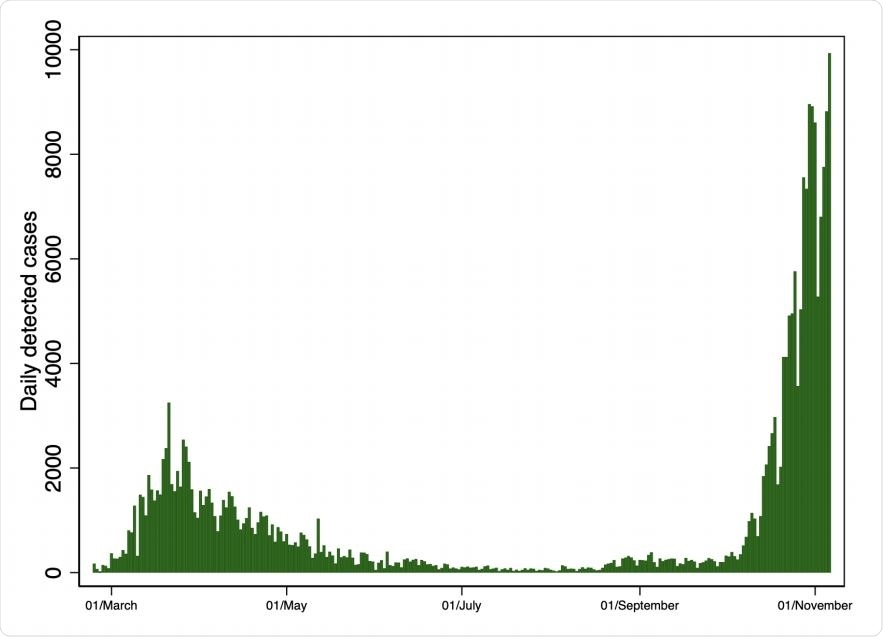
The severe acute respiratory syndrome coronavirus 2 (SARS-CoV-2), causing the COVID-19 pandemic is spreading rapidly throughout the globe. The first wave of infections was seen earlier this year, with the cases slowly decreasing in many parts of the world.
However, with the advent of fall, there has been a surge in the number of cases, especially in Europe, which studies had predicted. Italy, and particularly Lombardy, is now experiencing a second wave of infections.
The progression of the COVID-19 pandemic is closely mirroring that of the 1918 Spanish flu, which saw the first wave in spring 1918, which was mild, followed by a fatal wave in the fall of 1918, and a third less severe wave in the winter of 1918 and spring of 1919. The intensity of the first wave may have been different across the U. S., which could partly explain the regional variation in the mortality rates in the fall.

COVID-19 cases in Lombardy: first and second waves

 This news article was a review of a preliminary scientific report that had not undergone peer-review at the time of publication. Since its initial publication, the scientific report has now been peer reviewed and accepted for publication in a Scientific Journal. Links to the preliminary and peer-reviewed reports are available in the Sources section at the bottom of this article. View Sources
Modeling COVID-19 cases in Italy
In a new study published on the preprint server medRxiv*, researchers from the University of Bergamo in Italy, ETH Zurich, and Webster University Geneva report on the relationship between the severity of the first wave of the pandemic in spring 2020 and the second wave in fall 2020 in Lombardy, Italy.
The researchers first measured excess deaths between January 1 and May 31, 2020, by comparing deaths during the period to those for the same period in the years 2015–2019. They combined this with the data between September 1 and November 1, 2020, from the second wave, to compare the number of cases to the excess deaths during the first wave. They also included population age and air quality data.
When they analyzed the data, the team found that the number of cases in the second wave was lower in the municipalities that were hit more severely in the spring, suggesting the risk of infection may be lower in those areas.

Geographic distribution of first vs second COVID19 waves
Further regression analysis of the data with the second wave cases as the dependent variable revealed that the excess mortality coefficient was negative, suggesting a large number of excess deaths the first time correlates to a smaller number of cases during the fall wave. An increase in one standard deviation in the first-wave excess mortality corresponds to a 30% decrease in the number of cases detected in the second wave.
The researchers also controlled for cross-municipality interactions, as infections are not generally constrained to municipal boundaries. Using a spatial model, the team found a similar result; there was a negative relation between the excess deaths during the first wave and the number of cases during the second wave.
Previous studies have indicated that civic capital, or people coming together to solve community problems and contribute to the public good, can help in halting the spread of COVID-19. The researchers used the recycling of urban waste as a proxy for civic capital. They found that the decrease in the number of cases was more substantial for municipalities with higher civic capital. This result supports the idea that civic-minded populations think more about the effect of their behavior on the spread of infectious disease.
What the lower number of cases imply
The authors suggest there could be two possible reasons for the negative relation between the severity during the first wave and the cases during the second wave. It is likely that people living in the areas severely affected before changed their behavior to reduce virus spread, for example, frequent sanitization, and use of face masks.
In addition, exposure to the virus during the first wave could have provided immunity to a large proportion of the population, helping slow the spread of the virus during the second wave. However, the authors write that it was not possible to separate if the lower number of cases in the second wave was because of herd immunity or a change in people's behavior. It's likely that the two effects work together simultaneously.
The authors write, "policymakers interested in trading off the benefit of containment measures with the cost of shutting down economic activities should therefore tailor their policies to relatively small geographical areas."

 This news article was a review of a preliminary scientific report that had not undergone peer-review at the time of publication. Since its initial publication, the scientific report has now been peer reviewed and accepted for publication in a Scientific Journal. Links to the preliminary and peer-reviewed reports are available in the Sources section at the bottom of this article. View Sources