As the global coronavirus disease 2019 (COVID-19) pandemic continues, scientists are racing to develop immunizing vaccines and therapeutic drugs to fight against it. In order to do this, researchers are continuously trying to better understand this novel virus, how it replicates and its mechanism of infection.
A team of researchers at Heidelberg University in Germany have performed a detailed imaging analysis of severe acute respiratory syndrome coronavirus 2 (SARS-CoV-2) infection to determine how the virus reprograms infected cells.
SARS-CoV-2 entry into cells
The SARS-CoV-2 pathogen, which causes COVID-19, contains Spike proteins (S-protein) that bind with the host cell surface receptors to gain entry.
The S-protein binds with the angiotensin-converting enzyme 2 (ACE2) receptors to enter the cell and hijack its metabolic functions to replicate itself. These receptors thus act as a lock and critical tandem in SARS-CoV-2 infection.
The cells that become infected by SARS-CoV-2 die rapidly, within 24 to 48 hours. This means that the virus harms the human cell in such a way that it is rewired and forced to produce viral progeny.

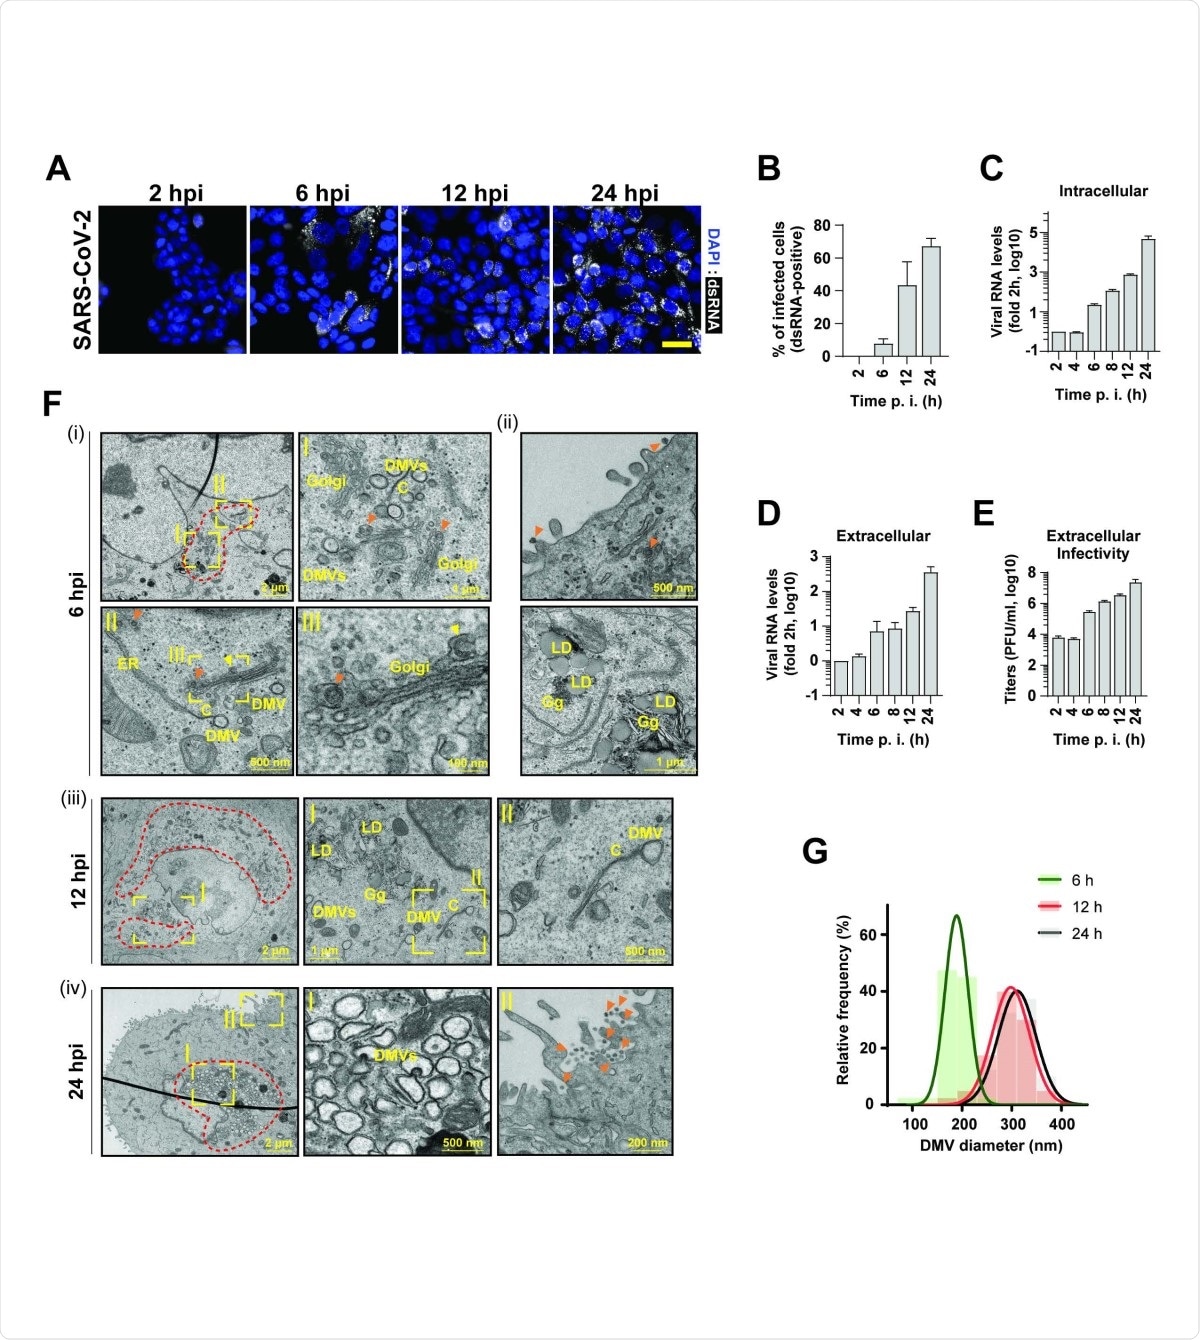
SARS-CoV2 infection kinetics in pulmonary epithelial cells. (A) Time course of SARS-CoV-2 replication in infected Calu-3 cells (MOI = 5) as detected by immunofluorescence using a dsRNA antibody (white). Nuclear DNA was stained with DAPI (blue). Scale bar: 40 µm. (B) Percentage of dsRNA positive cells quantified from panel (A). (C and D) Intra- and extracellular viral RNA levels measured by RT-qPCR. (E) Extracellular infectivity measured by plaque assay. Means and SDs of three independent experiments are shown in panels B-E. (F) Transmission electron microscopy images of 70-nm-thin sections of resin-embedded Calu-3 cells infected with SARS-CoV-2 (MOI = 5) and imaged at the indicated time points after infection. DMVs, double membrane vesicles; C, connectors; LD, lipid droplet; Gg, glycogen granules; orange arrow heads, completed virions; yellow arrowhead, budding virion. Areas in yellow rectangles are magnified in the corresponding panels marked with roman letters. Red dotted lines indicate regions with accumulations of DMVs. (G) Relative frequency distribution of DMV diameters determined at the different time points after infection. Gaussian fits are shown as overlay. N = 43, 40 and 48 DMVs for 6 h, 12 h and 48 h postinfection, respectively.
The study, which was published in the journal Cell Host & Microbe, aims to identify the morphological changes within a cell that are inherent to this reprogramming. This way, scientists can be better equipped to develop drugs that suppress viral replication and prevent virus-induced cell death.
Integrative imaging analysis
To arrive at the study findings, the researchers used a combination of light and electron microscopy methods to get an integrative view of the 3D architecture of SARS-CoV-2 induced viral replication organelles (vROs), their relationship with subcellular compartments, and the impact of viral infection on cellular organelles.
The team demonstrated whole-cell 3D reconstructions, showing marked morphological remodeling of many membranous organelles such as fragmentation of the Golgi apparatus and impairment in peroxisomes to viral replication organelles, which are formed by clusters of double-membrane vesicles (DMVs).

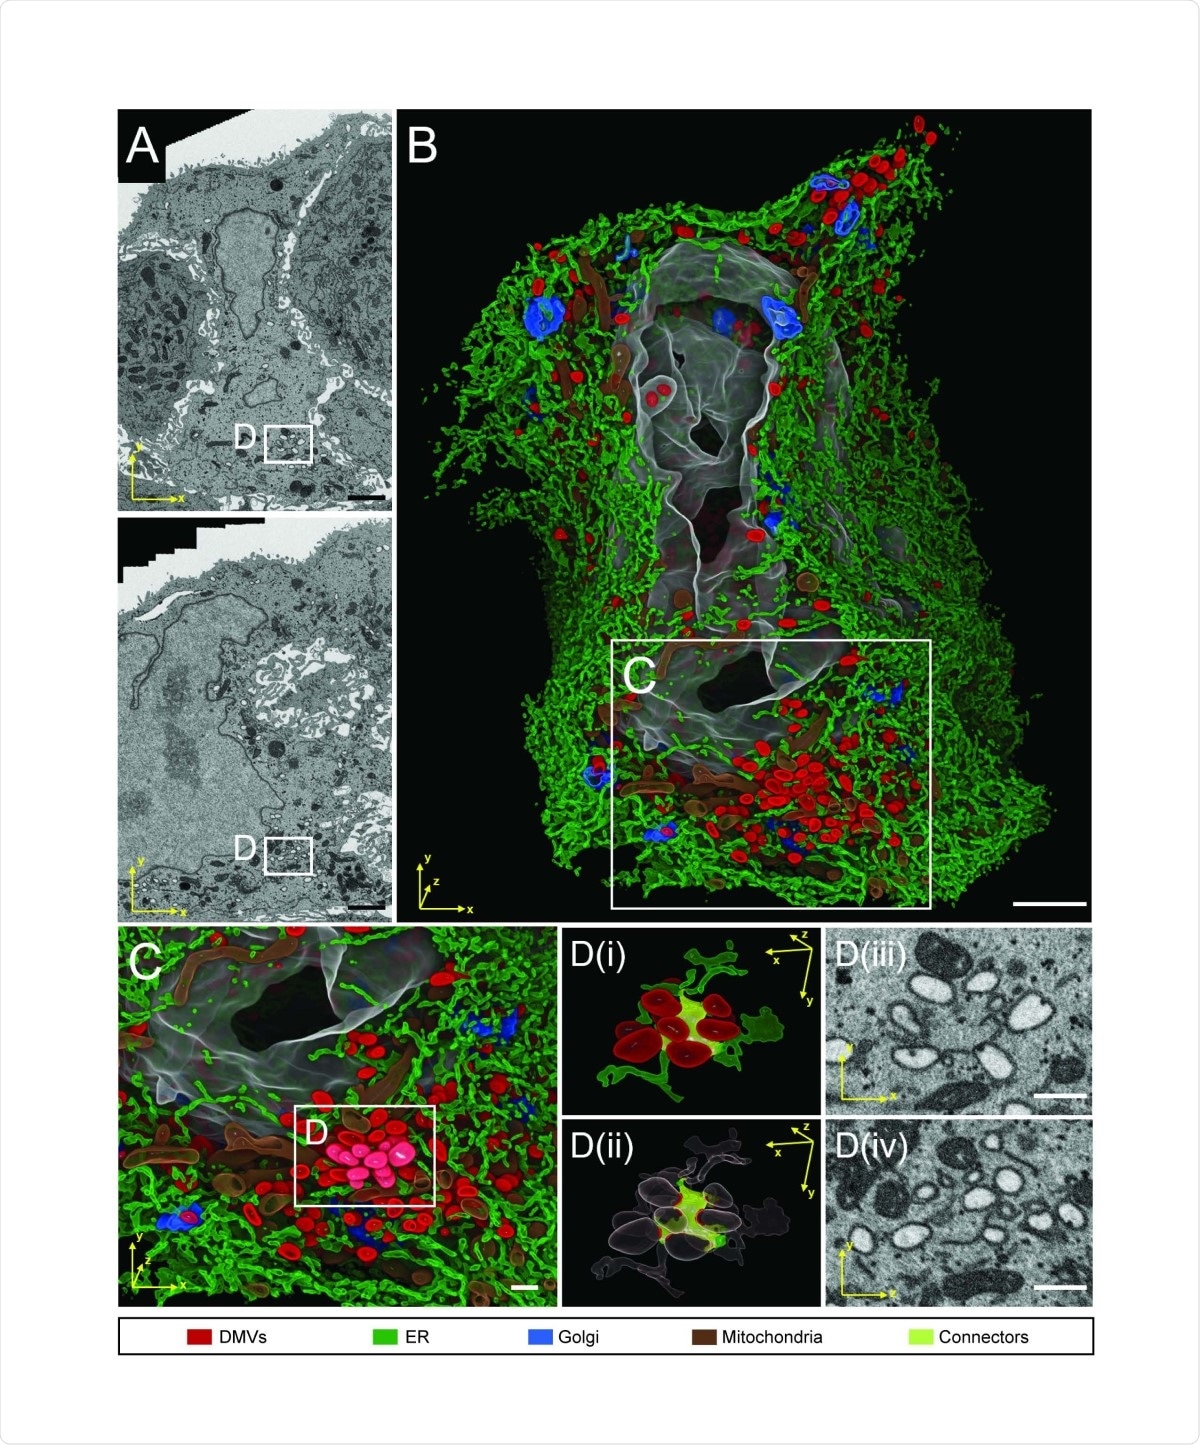
FIB-SEM analysis of whole cell volume of a SARS-CoV-2 infected cell reveals a network of DMVs and ER. Calu-3 cells were infected with SARS-CoV-2 (MOI = 5) for 24 h before being fixed and prepared for FIB-SEM analysis. (A) Two different slices through the cell volume. Note the tight association of the infected cell in the middle with the neighboring cells, giving the infected cell an hourglass-like shape in the top panel. (B) 3D rendering of the infected cell. The color code of subcellular structures is depicted on the bottom of the figure. (C) Zoom-in of the area indicated with rectangle in (B) showing a cluster of DMVs. (D) Detail of DMV - ER connections (i). DMVs are shown in red, membrane connectors are shown in citrus. (ii) Same as in (i) but with high level transparencies for DMVs and ER regions, except the areas in contact with the ER connectors. (iii and iv) Two orthogonal slices showing the raw data of the same region of the respective left panel. Scale bars: 2 µm in panels A and B, 500 nm in panels C and D.
Further, based on the results of live cell imaging and infection sensor, the team found there is an intense remodeling of the cytoskeleton elements.
Meanwhile, the team found that pharmacological inhibition of these dynamics suppresses SARS-CoV-2 replication.
Exploiting a cellular membrane system
The virus also triggers membrane changes wherein it produces its replication organelles. It happens in mini replication compartments where the viral genome is augmented enormously.
To do this, the virus exploits a cellular membrane system and creates an organelle. The scientists described it as a vast and massive accumulation of bubbles, which becomes a shielded compartment where viral genomes replicate and are released to become incorporated into new virus particles.
A couple of hours after infection, the team observed how and where the virus proliferates inside the cell. Also, they observed how the virus hijacks the host's machinery to be released after replication.
The researchers shared their results publically so the scientific community can use them to inform their studies about SARS-CoV-2. The data can be used to develop new drugs and vaccines to combat the COVID-19 pandemic.
"I believe we are setting a precedent on the fact that we are sharing all data that we produced with the scientific community. It represents an impressive resource to the community," Yannick Schwab, the study co-author, explained.
"This way, we can support the global effort to study how SARS-CoV-2 interacts with its host. The team hopes that their collected information will help in the development of antiviral drugs," he added.
COVID-19 global situation
To date, the virus has spread to 191 countries, infecting over 59.22 million people. SARS-CoV-2 has claimed more than 1.39 million lives.
Many countries report surging cases, including the United States, India, Brazil, and France, among others. The United States has the highest number of COVID-19 cases, topping 12.42 million cases, followed by India, with more than 9.17 million cases, Brazil with more than 6.08 million cases and France, with over 2.19 million cases.
Gaining insight into how the virus interacts with and affects human cells is vital to develop new therapies, drugs, and vaccines. Through 3D integrative imaging analysis, this study has shed light on the process of SARS-CoV-2's viral replication.
Source:
- COVID-19 Dashboard by the Center for Systems Science and Engineering (CSSE) at Johns Hopkins University (JHU) - https://gisanddata.maps.arcgis.com/apps/opsdashboard/index.html#/bda7594740fd40299423467b48e9ecf6
Journal reference: