Researchers in Scotland have conducted a study showing that the proportion of deaths due to coronavirus disease 2019 (COVID-19) resulting from infection with severe acute respiratory syndrome coronavirus 2 (SARS-CoV-2) increased in the UK after November 2020.
The analysis showed that throughout October and November 2020, the death rate was 1 in 55 cases detected during the previous 12 days.
However, this ratio was no longer sustained in December. The proportion of deaths was significantly greater and unexpectedly high, particularly in regions affected by the B.1.1.7 variant of concern that has recently emerged.
“In early December, some new factor emerged to increase the case-fatality rate in the UK,” write David Wallace from the International Center for Mathematical Science and Graeme Ackland from the University of Edinburgh.
A pre-print version of the research paper is available on the medRxiv* server, while the article undergoes peer review.

 *Important notice: medRxiv publishes preliminary scientific reports that are not peer-reviewed and, therefore, should not be regarded as conclusive, guide clinical practice/health-related behavior, or treated as established information.
The current reporting of infections and deaths can be misleading
Models that can predict how COVID-19 might impact healthcare systems are essential to making plans for even just a few weeks ahead.
In the UK, COVID-19-related deaths are reported in two ways. One is in the headline numbers published daily by the UK government (data that have become available in the previous 24 hours). The other is the publication of numbers derived from death certificates, which gives the number of deaths by date of death.
“Reporting of the former is highly variable over the week because of under-reporting during the weekend,” Wallace and Ackland write. “This can be smoothed out by taking 7-day rolling averages.”
As well as this weekend effect, under-reporting over Christmas and New Year also skewed the UK data, say the researchers. “To avoid this artefact, data for ‘date of death’ should be used,” they add.
The daily published headline number of positive tests or “cases” can also be misleading for the same reason.
In addition to the UK government data on cases, the Office for National Statistics (ONS) tracks the prevalence of SARS-CoV-2 in a representative fixed cohort. This provides an alternative to the unrepresentative national testing data for monitoring the case number.

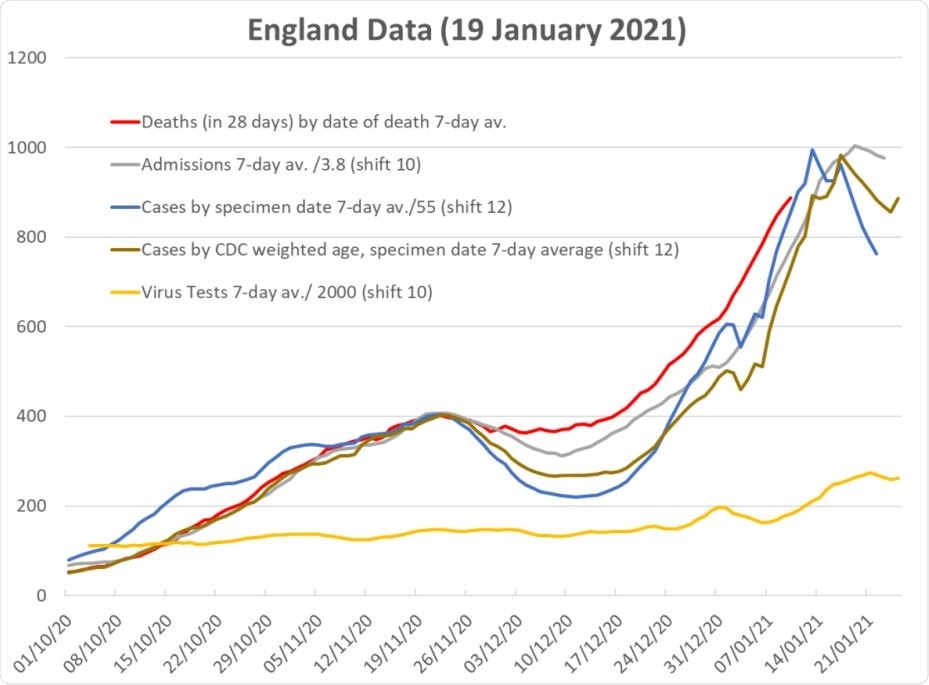
Data for England for deaths, compared with shifted and scaled data for admissions, raw data for (positive test) cases, cases weighted to account for age-morbidity. The shift-and scale factors are set so that all curves are coincident at the November peak. The yellow line shows the total number of tests.
What did the researchers do?
The team used publicly available government data and weekly data from the ONS Infection Survey to determine the relationship between reported infection cases and subsequent deaths during the UK coronavirus outbreak. The relationship was assessed across different UK regions and age groups, while accounting for the prevalence of the variant of concern (VOC) B.1.1.7.
The researchers assessed whether a two-parameter “shift-and-scale” model could reliably predict deaths as a result of reported cases.
Since a ratio of tests to cases was being assessed, this model was chosen because a “shift-and-scale” relationship is not affected by the total number of cases. Therefore, the data generated should not be influenced by interventions implemented to curb viral spread or by the prevalence of the more infectious VOC.
What did they find?
Throughout October and November 2020, the age-weighted positive test data were in excellent agreement with subsequent deaths. During this period, the death rate was 1 in 55 cases detected during the previous 12 days.
However, the relationship between positive tests and subsequent deaths significantly changed around early December, such that the shift-and-scale model failed, showing a reduction in cases and admissions that was not reflected by a reduction in deaths.
Since the model’s predictions are fully determined by data, this means there was a significant increase in case-fatality ratio (CFR) in areas where cases and fatalities are as defined by the UK government, say the researchers. The CFR was particularly high in regions affected by the VOC B.1.1.7.
What are the study implications?
Wallace and Ackland say this increase in observed versus expected deaths shows that “something changed.” The correlation of increased CFR with VOC suggests causation, they add.
One interpretation would be that the new variant produces more severe disease, but there is currently no clinical evidence to support this hypothesis, says the team.
Finally, the researchers suggest that “alternately, the test may be less sensitive to the VOC, or the VOC infection may have taken off in undertested parts of the population.”

 *Important notice: medRxiv publishes preliminary scientific reports that are not peer-reviewed and, therefore, should not be regarded as conclusive, guide clinical practice/health-related behavior, or treated as established information.