The UK variant severe acute respiratory syndrome coronavirus 2 (SARS-CoV-2), known as B.1.1.7 or VOC-202012/01, emerged in the UK in late 2020, quickly spreading to become the dominant variant in several countries. A research paper recently uploaded to the preprint server medRxiv* by Vespignani et al. (February 22nd, 2021) uses mathematical models to map the spread of this lineage across Europe, establishing that a 50% increase to the transmissibility of the variant would allow it to become dominant in major metropolitan areas by the end of March 2021.

 *Important notice: medRxiv publishes preliminary scientific reports that are not peer-reviewed and, therefore, should not be regarded as conclusive, guide clinical practice/health-related behavior, or treated as established information.
How was the model constructed?
Several European cities and their greater metropolitan regions were included in the study: Berlin, Frankfurt, Milan, Rome, Barcelona, and Madrid. Data from Denmark, Greece, Poland, and Portugal was also utilized, and the individuals were divided into ten age groups aged 0 to 80+.
The model assumes that only B.1.1.7 and wild-type variants exist, and also sets the emergence date of the B.1.1.7 lineage as September 13th 2020, with a transmissibility 50% over the wild-type. It accounted for non-pharmaceutical interventions such as lockdowns using data sourced from local authorities. Three scenarios were considered: status quo, where non-pharmaceutical interventions and population behaviors stay the same; conservative relaxation, where population contact is increased by 25%; or moderate relaxation, where population contact is increased 50%.
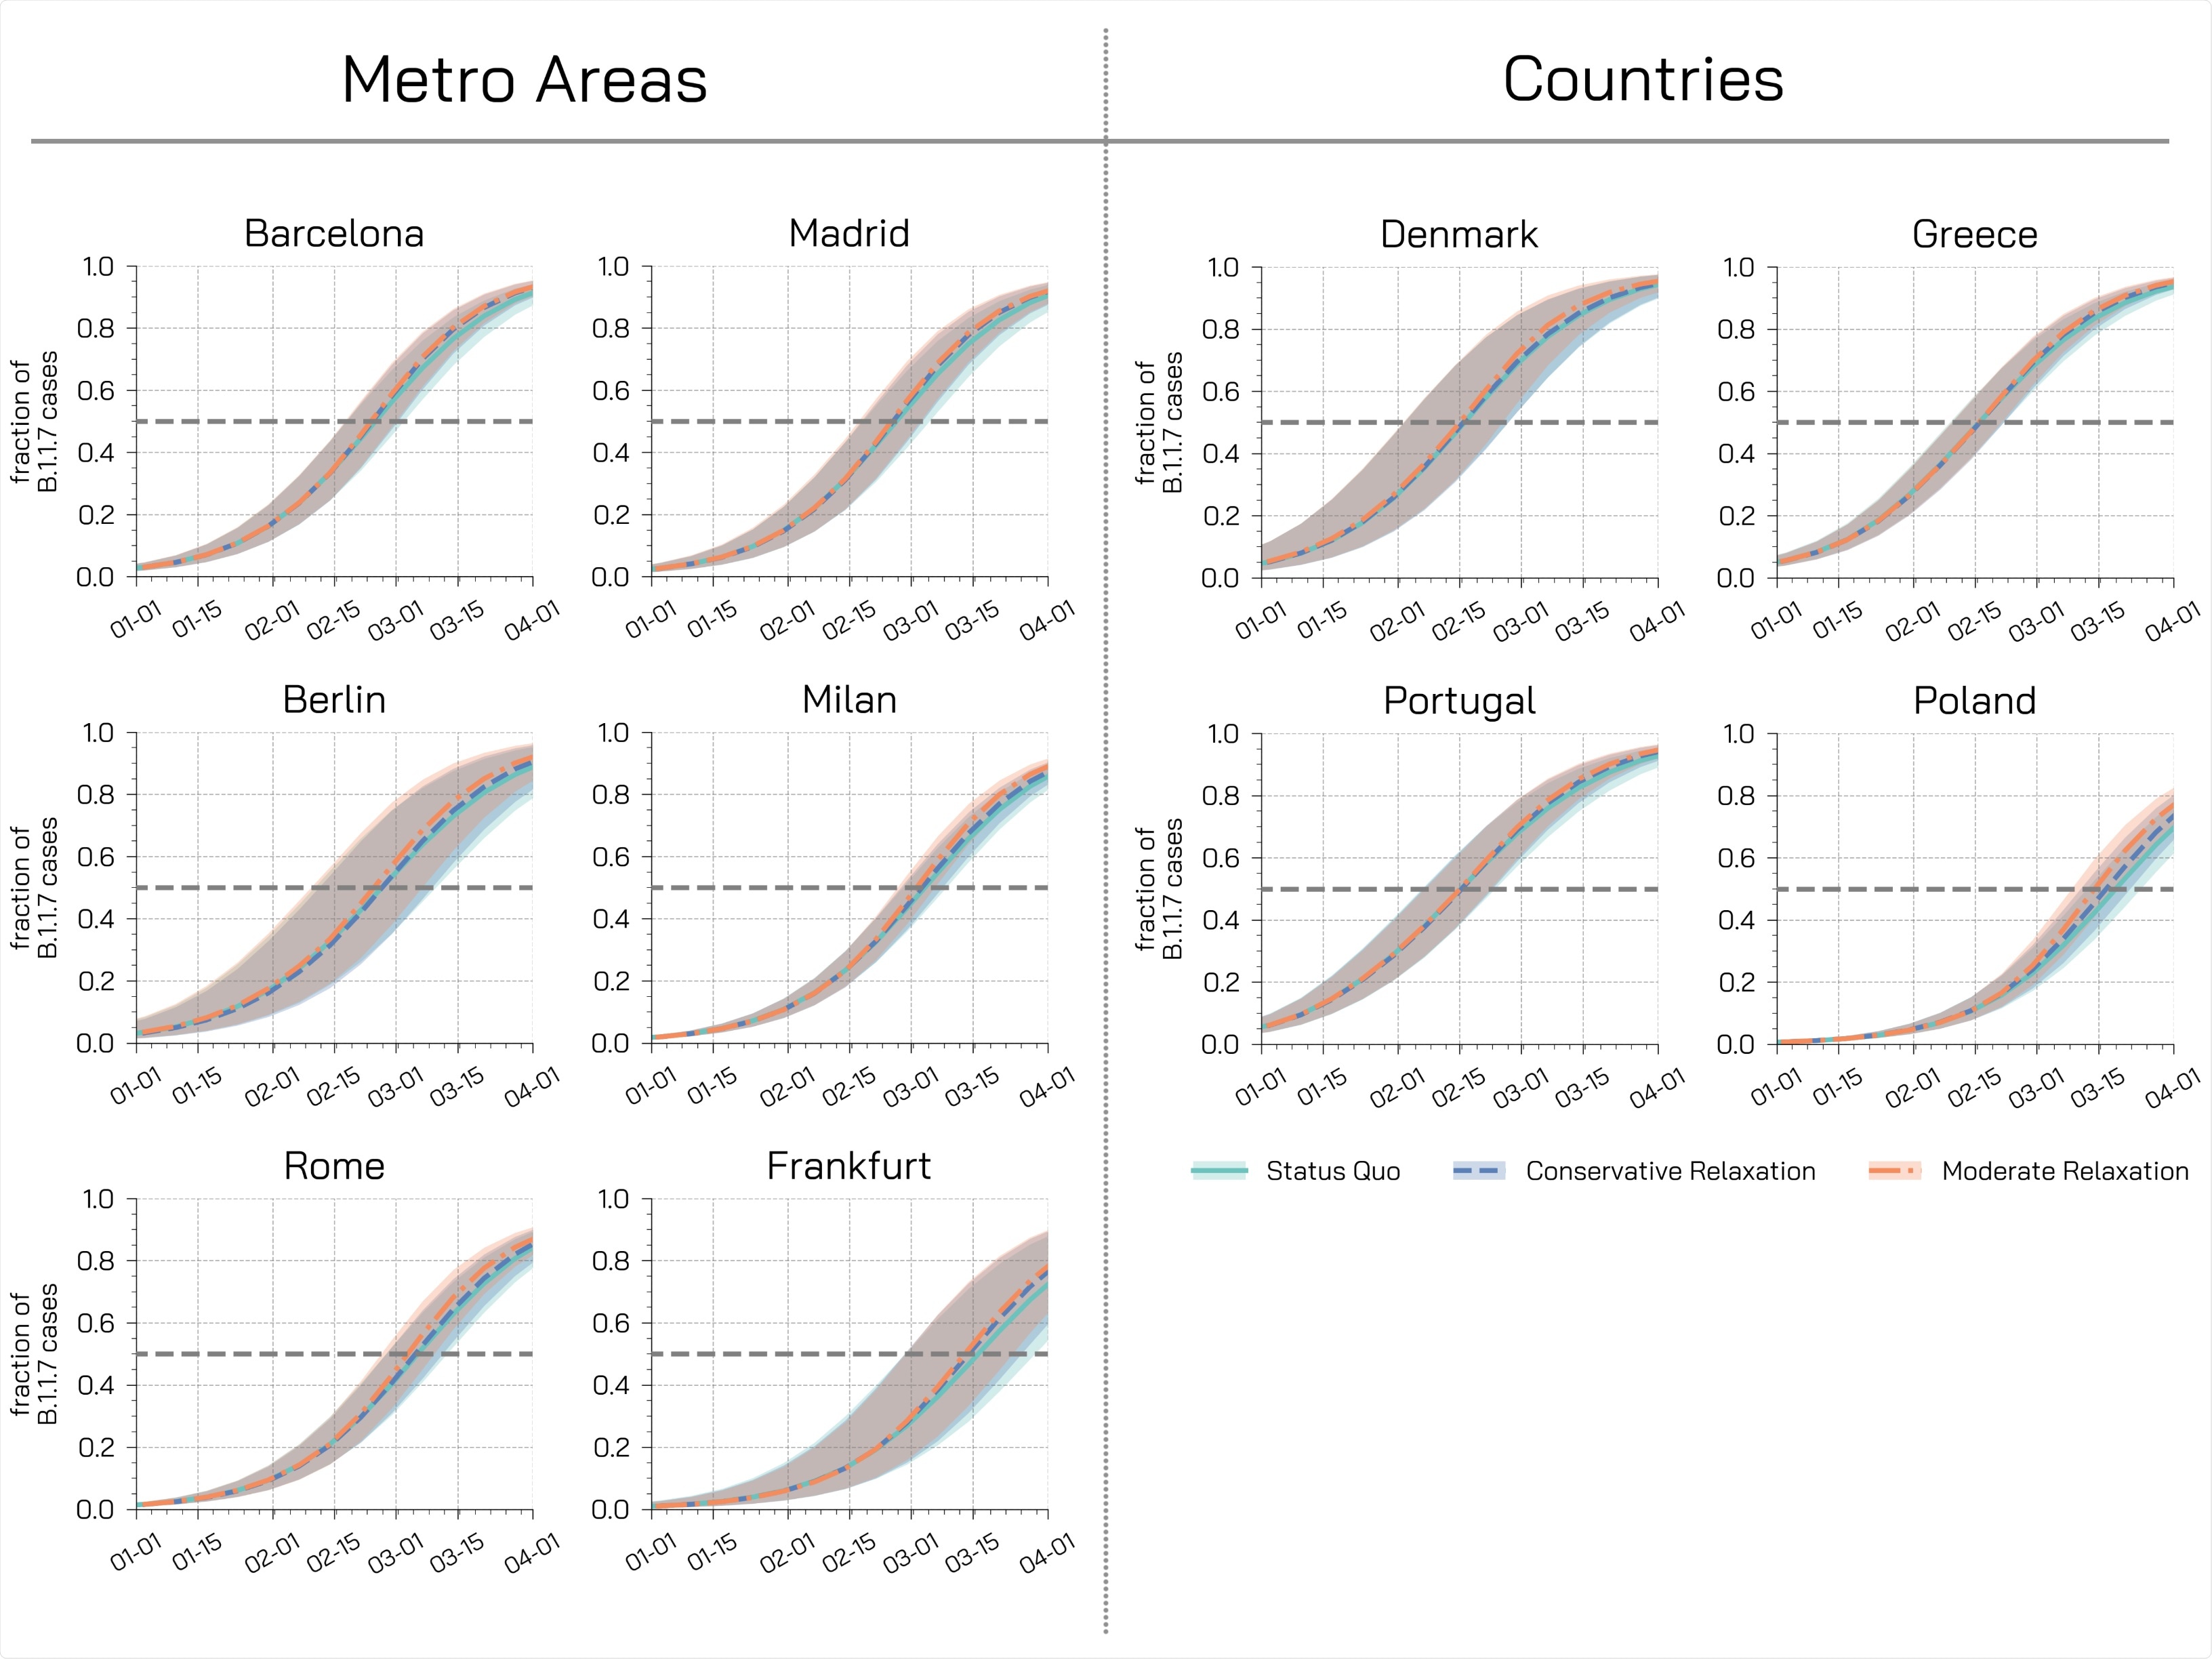
Assuming a status quo behavior, the B.1.1.7 lineage would be expected to become the dominant one in Denmark, Greece, and Portugal by February 15th, and Poland by March 15th, with the major cities examined in detail also failing between these dates. Interestingly, relaxed behaviors had relatively little sway on the population proportion, with, for example, 92% of SARS-SoV-2 being the B.1.1.7 lineage in Barcelona by March 31st under status quo conditions, and 93% and 94% under conservative and moderate relaxation, respectively.

Fraction of new cases attributable to the B.1.1.7 variant. Each plot shows the fraction of new weekly cases attributable to the variant in di�erent regions for di�erent restrictions scenarios under the assumption of a 50% increase in transmissibility. Dashed horizontal lines represent the dominance threshold of 50% of new cases caused by the B.1.1.7 variant. The shaded areas represent the 50% CI.
The cities were expected the present a dominance of the B.1.1.7 lineage of 85-94% in Madrid, Berlin, Milan, and Rome, with a lesser proportion of 74-80% in Frankfurt by the end of March. The countries, similarly, are expected to see 93-95% representation of B.1.1.7 in Denmark, Greece, and Portugal, with a lesser rate of 72-79% in Poland. Each location is expected to experience a fluctuating and differently peaking death rate by the model, which was compared with weekly death data from each location dating back to April 2020 with good agreement.
Data collected by PCR that confirmed the variant of SARS-CoV-2 was later collected from Portugal, Denmark, and the Italian regions of Milan and Rome and compared to the model. The model was in-line with the observed proportion of B.1.1.7 in the population within a 95% confidence interval, suggesting that more long-term predictions bear validity. It should be noted however that Portugal had only two data points for this comparison from December 2020 and January 2021, while Milan and Rome had only one. Denmark, however, had seven that fit the predicted curve well from between December 2020 to February 2021.
The authors note that the study is limited in not accounting for population density or mobility within the regions of interest. Additionally, presymptomatic or asymptomatic individuals may not have been detected by the PCR tests employed, and thus the number of COVID-19 positive individuals could be underaccounted.

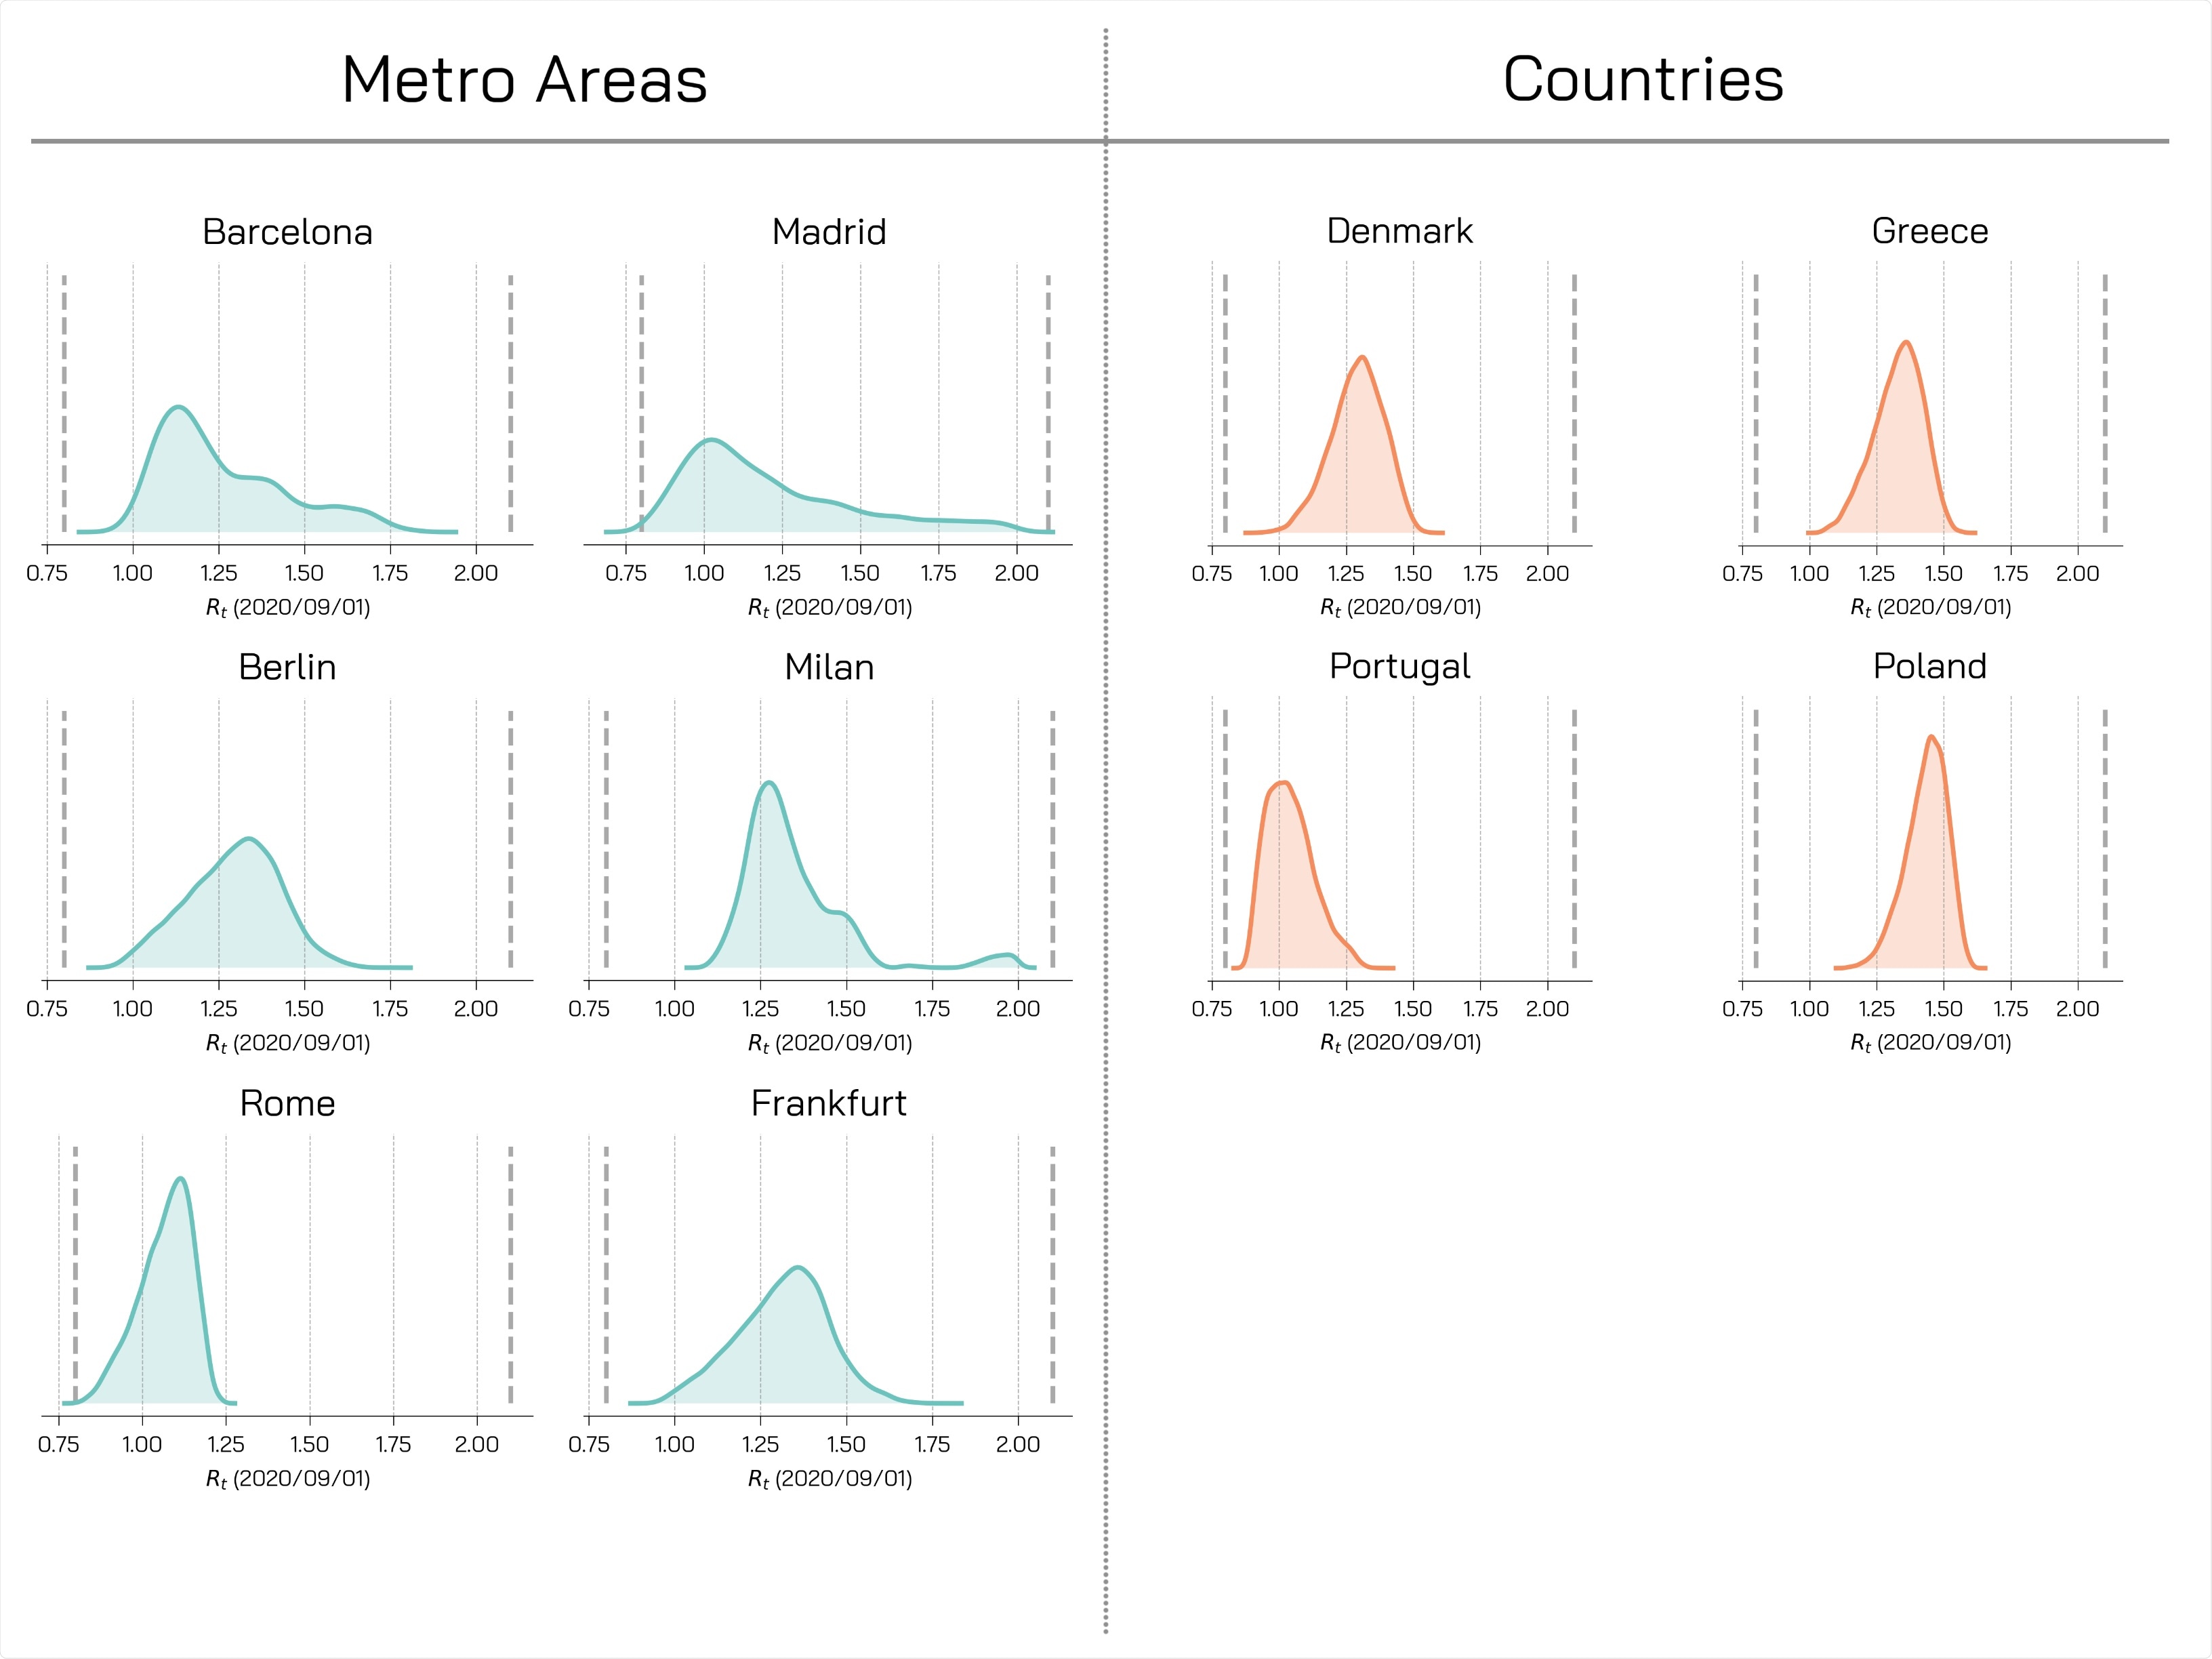
Posterior Distributions - Rt. For different regions, we represent the posterior distributions for Rt on 2020=09=01. These posterior distributions are obtained for ψ = 0:5 and weighted mean absolute percentage error as a distance metric with a tolerance e of 0:35.
What are the implications?
Other research based on modeling data from the USA and France has also suggested that the B.1.1.7 variant will be dominant in those countries by March 2021. Within the cities examined vaccination campaigns are not expected to have immunized large portions of the population within the first three months of 2021 and the higher transmissibility of this lineage could negatively offset non-pharmaceutical interventions, leading the authors to suggest caution in relaxing lockdown procedures while strengthening testing.

 *Important notice: medRxiv publishes preliminary scientific reports that are not peer-reviewed and, therefore, should not be regarded as conclusive, guide clinical practice/health-related behavior, or treated as established information.
Journal reference:
- Preliminary scientific report.
Estimating the spreading and dominance of SARS-CoV-2 VOC 202012/01 (lineage B.1.1.7) across Europe, Nicolò Gozzi, Matteo Chinazzi, Jessica T Davis, Kunpeng Mu, Ana Pastore y Piontti, Marco Ajelli, Nicola Perra, Alessandro Vespignani, medRxiv, 2021.02.22.21252235; doi: https://doi.org/10.1101/2021.02.22.21252235, https://www.medrxiv.org/content/10.1101/2021.02.22.21252235v1