The massive and continuing outbreak of coronavirus disease 2019 (COVID-19), caused by the severe acute respiratory syndrome coronavirus 2 (SARS-CoV-2), throughout the world, has led to a staggering toll of over 549,000 deaths in the USA, among over 30 million cases. A new preprint research paper posted to the medRxiv* server discusses the factors related to the chances of testing positive for this virus.
The spread of the virus is strongly linked with the ability to test for its presence and segregate infectious individuals. Thus, testing capacity and reliability, as well as accessibility, have been vital in monitoring the outbreak and to treating patients.
This requires a better understanding of what affects test results, as this could shape testing strategies and influence the weight attached to a positive test result. COVID-19 tests include both polymerase chain reaction (PCR) tests for the viral nucleic acid or rapid antigen tests to detect viral antigens, as well as antibody tests for specific SARS-CoV-2 antibodies.
Study aims
The current study used data from electronic health records (EHRs) in the US to explore the characteristics of patients who underwent SARS-CoV-2 testing in clinical practice, as well as trends in testing and positivity rates over time. Thirdly, the investigators attempt to examine the degree of agreement between viral and antibody testing.
Viral tests
This study included data on over 800,000 patients who had been tested for the infection in the real-world setting of the pandemic.
Viral tests had a positivity rate of 9%, and antibody tests resulted in 12% positivity. Overall, there was a 90% to 93% agreement between the results of antibody and viral tests among those who received both.
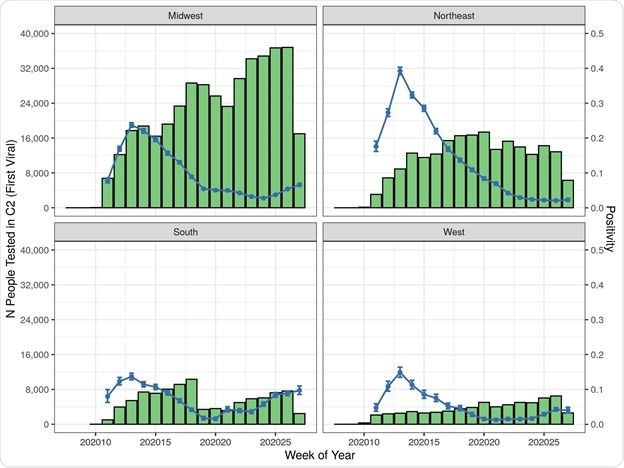
Positivity rates showed an inverse correlation with the number of people tested in any group and went down over time, irrespective of region or race.
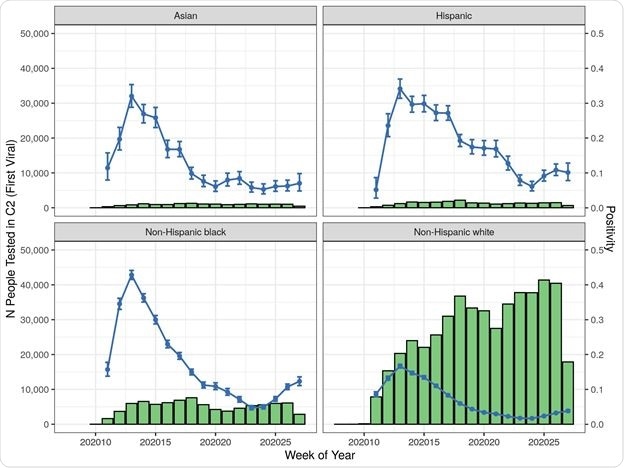
Risk factors for being positive included being male (increased positivity odds by 20%), Hispanic or non-Hispanic Black and Asian, and having inadequate health insurance.
Being part of these ethnic groups increased the viral positivity odds by two-to three-fold. Populations in the northeast of the USA, the presence of diabetes, obesity, and dementia, were also associated with higher test positivity.

Patient Count and Positivity by Cohort, Index Date, Region, and Race/Ethnicity

 This news article was a review of a preliminary scientific report that had not undergone peer-review at the time of publication. Since its initial publication, the scientific report has now been peer reviewed and accepted for publication in a Scientific Journal. Links to the preliminary and peer-reviewed reports are available in the Sources section at the bottom of this article. View Sources
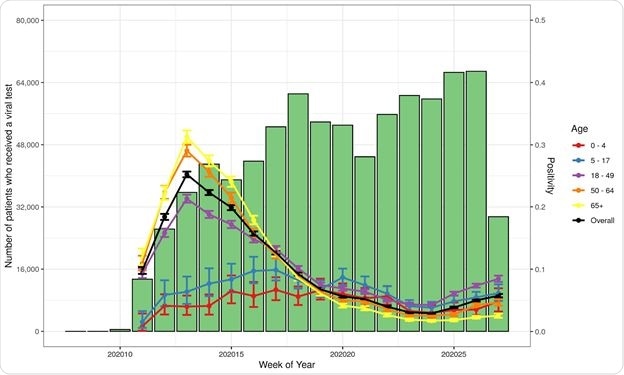
Testing results in children appear to be somewhat less predictable, showing more discrepancies between viral and antibody testing, with antibody tests having a higher positivity rate in this group. The chances of being positive were 40% less than among young adults up to 34 years of age when both had the same number of symptoms.
The presence of anosmia/dysgeusia was associated with a seven-fold risk of testing positive. At the same time, with acute respiratory distress, it was six-fold and four-fold if the patient had pneumonia. Smaller increases were noted with chest infections, loss of appetite, and cough.
As measured by a week of study, the Northeast region showed a high initial odds ratio for positive test rate, which decreased over time, unlike the West, which showed the highest odds for test positivity in the final study week. Higher odds of positivity with time were also seen in the American South.

Cohort 2 (Viral Test) Patient Counts and Positivity Rate by Index Date by Region

Cohort 2 (Viral Test) Patient Counts and Positivity Rate by Index Date by Race/Ethnicity
Antibody tests
Antibody tests were positive in 12% and were twice as likely to be positive among children and those with inadequate insurance (seven-fold the rates observed in patients on commercial insurance plans). The positivity rate increased 2.5 to 3-fold among Blacks or Hispanics.
Among Northeast residents, antibody tests were four-fold more likely to be positive. Patients with a prior positive viral test were at 44 times the odds of having a positive antibody test, while a previous negative viral test reduced the odds to half, compared to those without an earlier viral test.
Of those who received antibody tests, 17% had symptoms suggesting COVID-19 during the six weeks prior to testing, with the large majority (60%) being in the week immediately preceding the test. About 16% had a viral test before the antibody test, with a fifth of these being antibody positive.
About 90% of those who received a viral test followed by an antibody test on the same day showed concordant findings. Discordant results occurred more commonly if the viral test was positive and the antibody test was done within the two weeks following.

Number of Patients Tested and Percent Positive for Initial SARS-CoV-2 Viral Test by Age
What are the implications?
The findings show that minority populations are tested less than the population at large, though their test positivity rates (PR) are higher. People with a higher index of underlying illness, as measured by the Charlson Comorbidity Index, had lower positivity rates.
Increased test positivity is also linked to inadequate health insurance. These results agree with the presence of social and economic inequalities in the US. The test positivity rates are also shaped by the fact that different groups have varying levels of exposure to the virus and different levels of access to testing.
The comparison of results from viral and antibody tests shows that they are mostly in agreement. However, to qualify this, it appears that the interval between a viral test and an antibody test should be at least two weeks for highly concordant results to be obtained.
This interval probably mirrors the time required for seroconversion. The interesting thing is the high concordance between these tests since the tests are quite different. This is a welcome finding since the test results available within the different EHRs cannot be directly evaluated regarding their sensitivity or specificity.
The positivity rate among children depends more heavily on the type of test, with higher positivity odds with antibody tests. The underlying factors here may include clinical status at the time of testing, the severity of illness, and the immune response. This reflects earlier national surveillance data.
The EHR data shows the importance of chemosensory dysfunction as a predictor of test positivity, as well as of fever, cough, and chest infections. At the same time, some symptoms seem to have a low association with test positivity. This could be a false association, due perhaps to low testing rates among patients at high risk of infection.
Alternatively, it could be that the symptoms are too non-specific and thus dilute the test positivity. Or these symptoms may be present early in the disease when the tests are less sensitive.
As with earlier studies, test positivity is lower among people at high risk of infection due to multiple underlying chronic illnesses. This may appear to be counter-intuitive but is attributable to self-protective behavior or an increased tendency to test such groups.
Among this group, however, obesity, diabetes and dementia continue to demonstrate strong positive associations with severe disease.
“Our findings identify the need for additional testing among minority patients and provide novel findings related to antibody testing.”

 This news article was a review of a preliminary scientific report that had not undergone peer-review at the time of publication. Since its initial publication, the scientific report has now been peer reviewed and accepted for publication in a Scientific Journal. Links to the preliminary and peer-reviewed reports are available in the Sources section at the bottom of this article. View Sources