Every country has been affected by the severe acute respiratory syndrome coronavirus 2 (SARS-CoV-2) that has spawned a pandemic. For several factors, the United States has been hit hard by the number of coronavirus cases and death. The country currently leads the world with over 32.4 million infections and more than 577,000 COVID-19 deaths.
But not all states have been equally affected by the coronavirus, with certain U.S. counties — Los Angeles, California, Maricopa, Arizona, and Cook, Illinois — having a higher number of cases. There’s also a possibility for underreporting of COVID-19 cases and deaths. Research led by Andrew C. Stokes of Boston University School of Public Health modeled the expected mortality rate in 2020 and estimated excess deaths that were not attributed to COVID-19.
They found differences between state-level COVID-19 mortality rates and the estimated number of excess deaths by county.
“The present study builds on prior work by extending estimates of excess mortality and excess deaths not assigned to COVID-19 to U.S. counties. The added geographic detail of these estimates compared to prior studies may facilitate additional research on the causes and consequences of the COVID-19 pandemic on population health and provide useful data for local area health policy and planning,” wrote the authors.
The study “County-Level Estimates of Excess Mortality associated with COVID-19 in the United States” is available as a preprint on the medRxiv* server, while the article undergoes peer review.
How they did it
The team created a linear model using historic data from 2011-2019 to predict excess mortality rates in 2020.
Excess death was defined as the differences between the predicted versus the observed number of all-cause deaths in 2020. Excess deaths not attributed to COVID-19 infection were described as the number of excess deaths in 2020 and the number of observed directly assigned COVID-19 deaths.
The researchers only used counties with statistically significant increases in excess deaths, which exceeded expectations for the number of deaths in 2020. The researchers suggest several possibilities for why some counties did not experience substantial increases in excess mortality including, incomplete data, counties with small populations, effective health policy measures or geographic isolation that mitigated the spread of COVID-19, and counties with higher mortality rates attributed to vehicle accidents, flu infections, or other non-COVID causes of death.

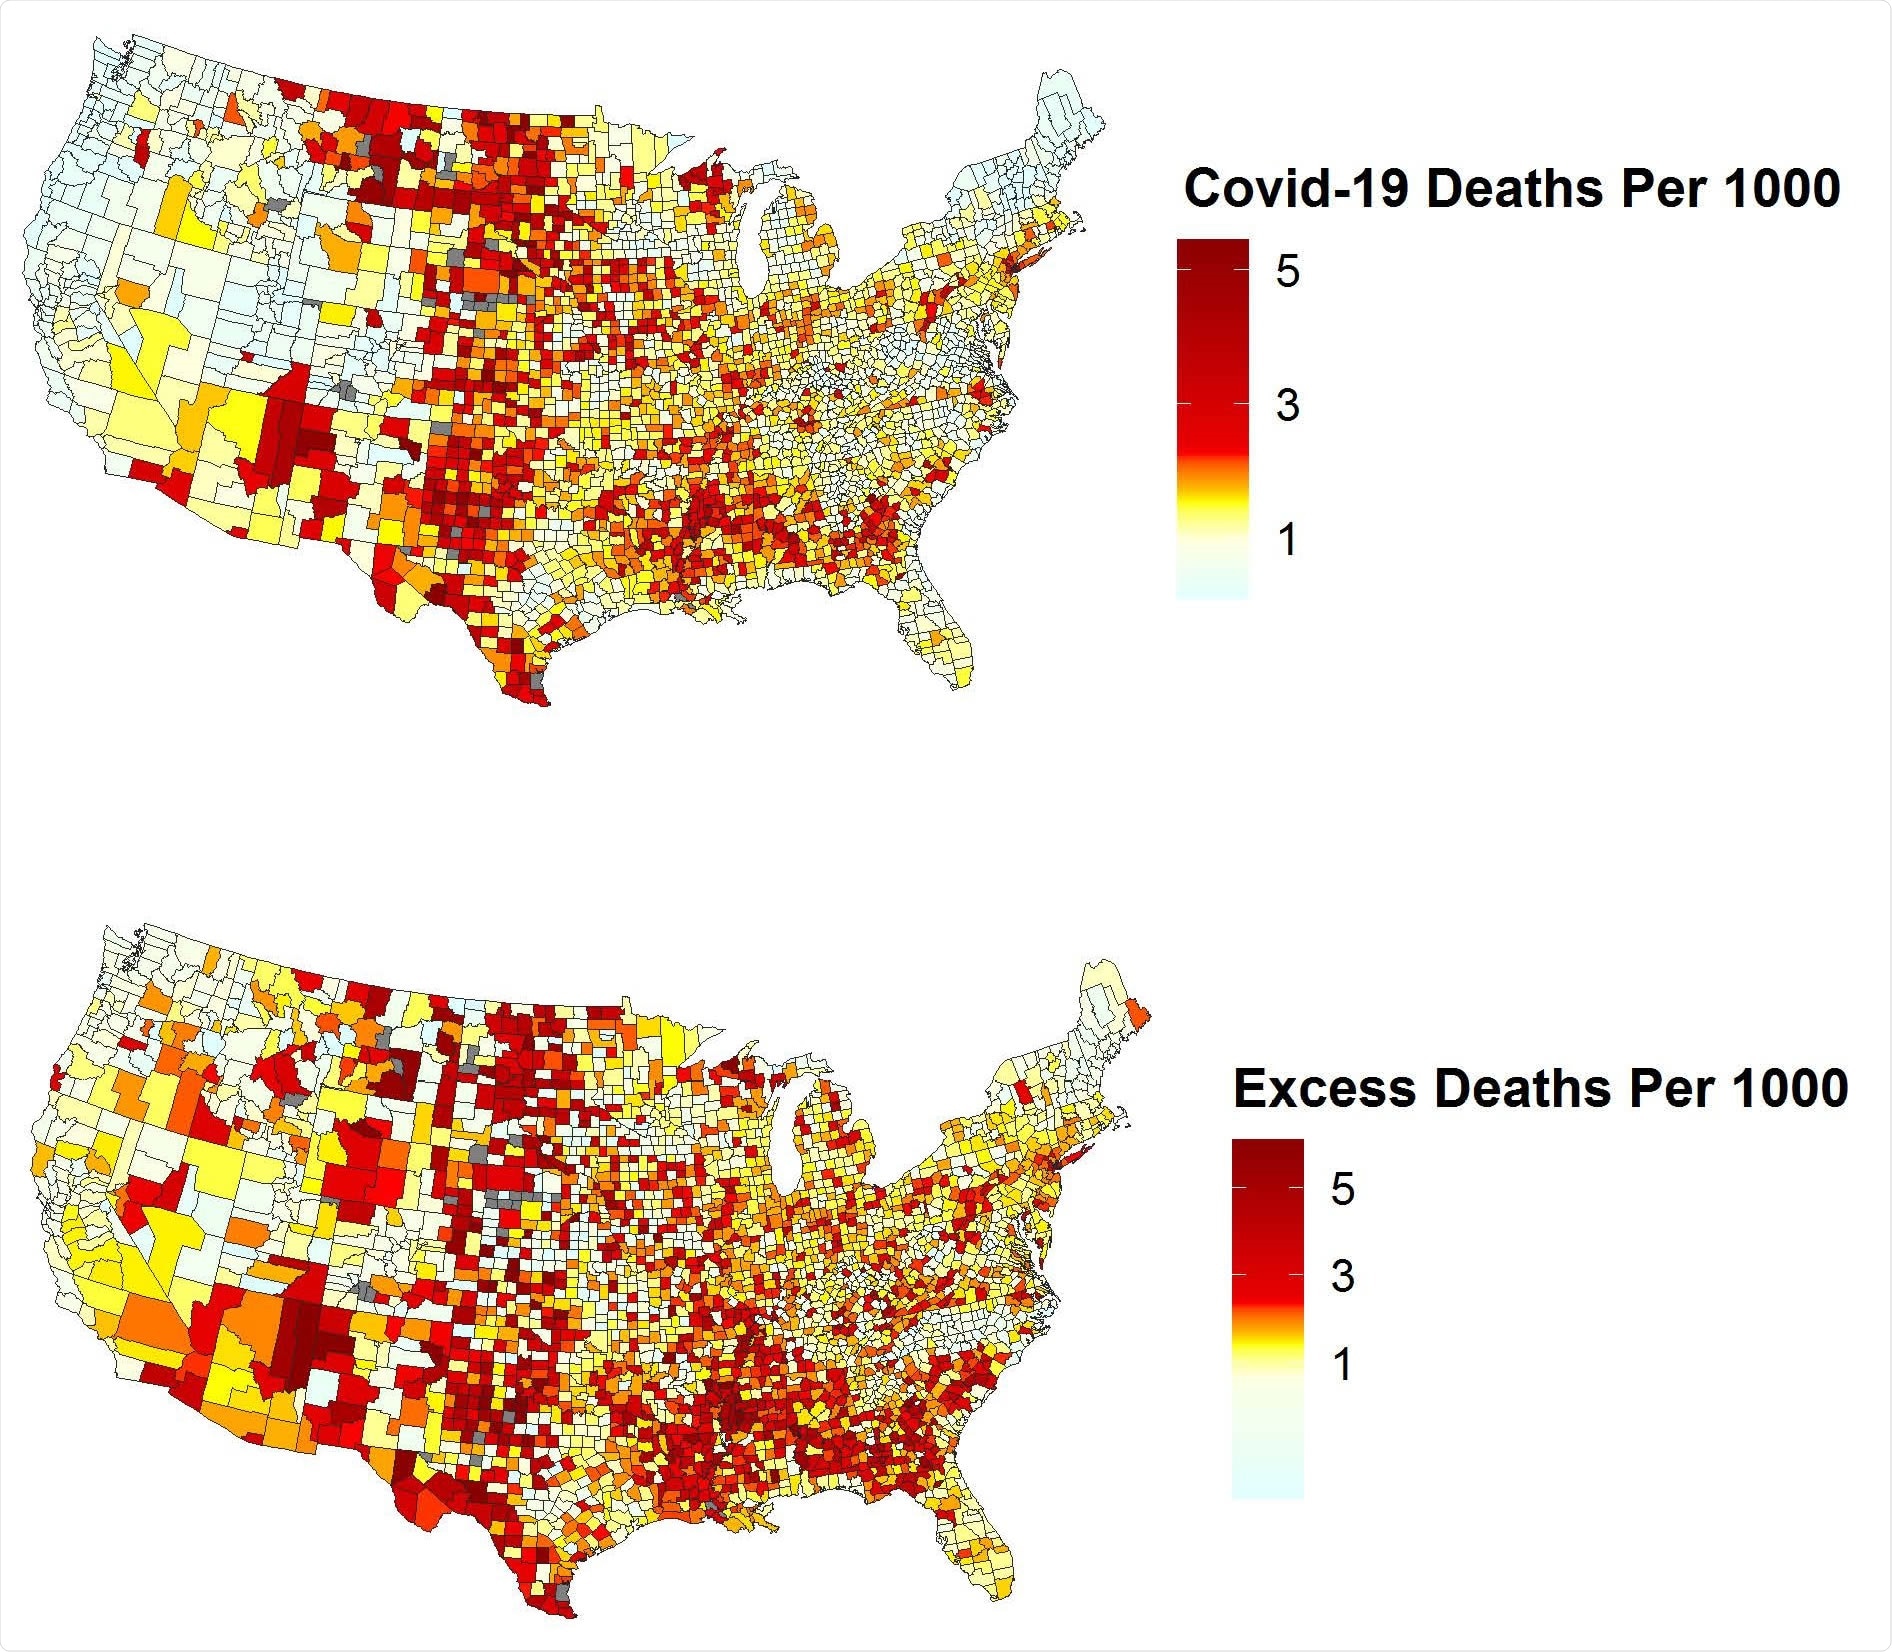
COVID-19 Deaths by County (Per 1000 Person-Years). Heat maps of direct COVID-19 deaths per 1000 person-years by county (top) and excess death rate per 1000 person-years by county (bottom). Numbers are based on provisional data from the National Center for Health Statistics (NCHS) on COVID-19 mortality by county of residence from January 1 to December 31, 2020 reported by April 21, 2021. Note that estimates for counties in North Carolina may be unreliable due to reporting lags.

 This news article was a review of a preliminary scientific report that had not undergone peer-review at the time of publication. Since its initial publication, the scientific report has now been peer reviewed and accepted for publication in a Scientific Journal. Links to the preliminary and peer-reviewed reports are available in the Sources section at the bottom of this article. View Sources
Inaccuracy of reporting data for COVID-19 mortality rates in 2020
Some counties were more affected than others in the pandemic. Researchers found high direct COVID-19 death rates and high excess death rates, such as McKinley County in New Mexico and Lamb County in Texas.
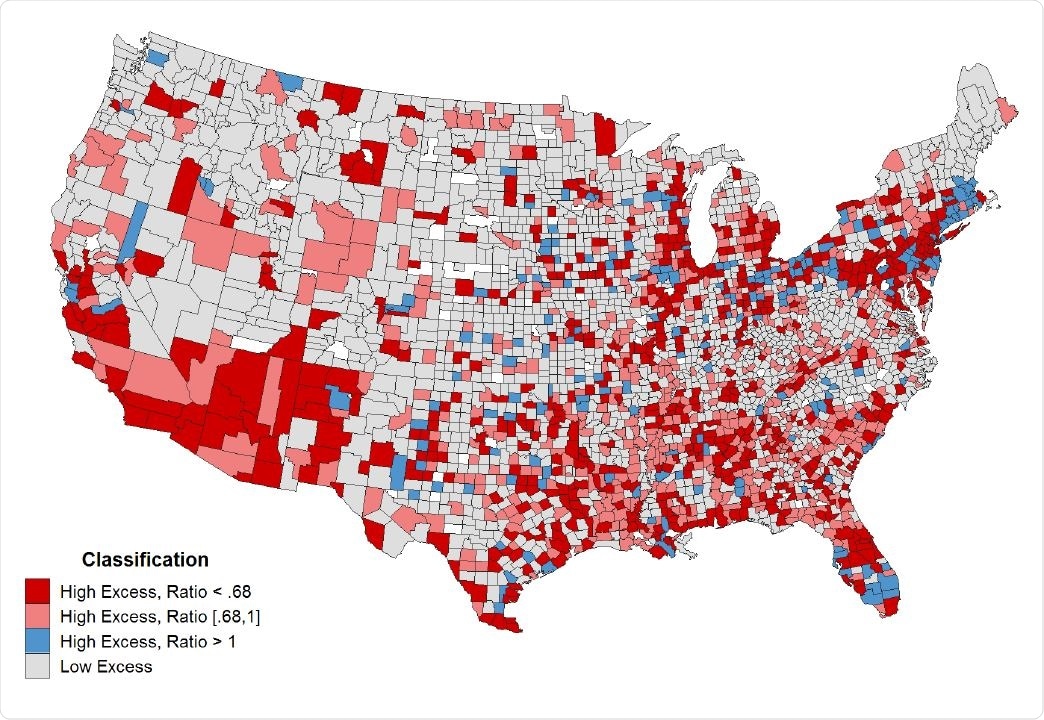
Meanwhile, other counties — Aransas County in Texas, Dallas County in Montana, and Clarke County, in Alabama — who reported high excess death rates did not assign COVID-19 as the cause of death for many mortality cases. The results suggest using direct COVID-19 death rates as the measure may have changed the reporting of excess mortality between counties.
Rural counties had higher mortality cases assigned to COVID-19 and excess death rates compared to urban counties. Proportion-wise, rural counties had 67% of excess deaths related to COVID-19 than 83% of urban areas.
The South and Midwest experienced more COVID-19 deaths and excess deaths than the Northeast and West. But when looking at the proportion of excess deaths related to COVID-19, measures used to determine this amount suggested lower COVID-19 mortality rates amongst the West (75%) and South (76%) compared to the Northeast (94%) and Midwest (81%).

Classification of Counties based on Excess and COVID-19 Deaths. U.S. counties colored according to four major categories: (1) high excess death rate and less than 68% of excess deaths assigned to COVID-19, (2) high excess death rate and between 68% and 100% of excess deaths assigned to COVID-19, (3) high excess death rate and directly assigned death rate exceeds excess death rate, and (4) low or negative excess death rate. High excess indicates that the county had total deaths in 2020 that exceeded the upper 95% prediction interval threshold. Ratio denotes the ratio of direct COVID-19 deaths to excess deaths. Note that estimates for counties in North Carolina may be unreliable due to reporting lags.
County results differ by geographic location
The researchers found 47% of excess deaths in nonmetro areas in the Middle Atlantic division were attributed to COVID-19 compared to metropolitan areas that assigned 85% of mortality cases in 2020 to coronavirus infections.
In the Pacific division, only 39% of excess deaths were attributed to COVID-19 in nonmetro areas compared to the 78% reported in large central metros.’
New England metro areas contrasted with other metro areas by having a low number of COVID-19 deaths. However, the researchers suggest this is likely due to increases in other non-COVID causes of death. But in large central metros in New England, there were 132% excess deaths assigned to COVID-19. Nonmetro areas in New England had 64% of excess deaths related to COVID-19.

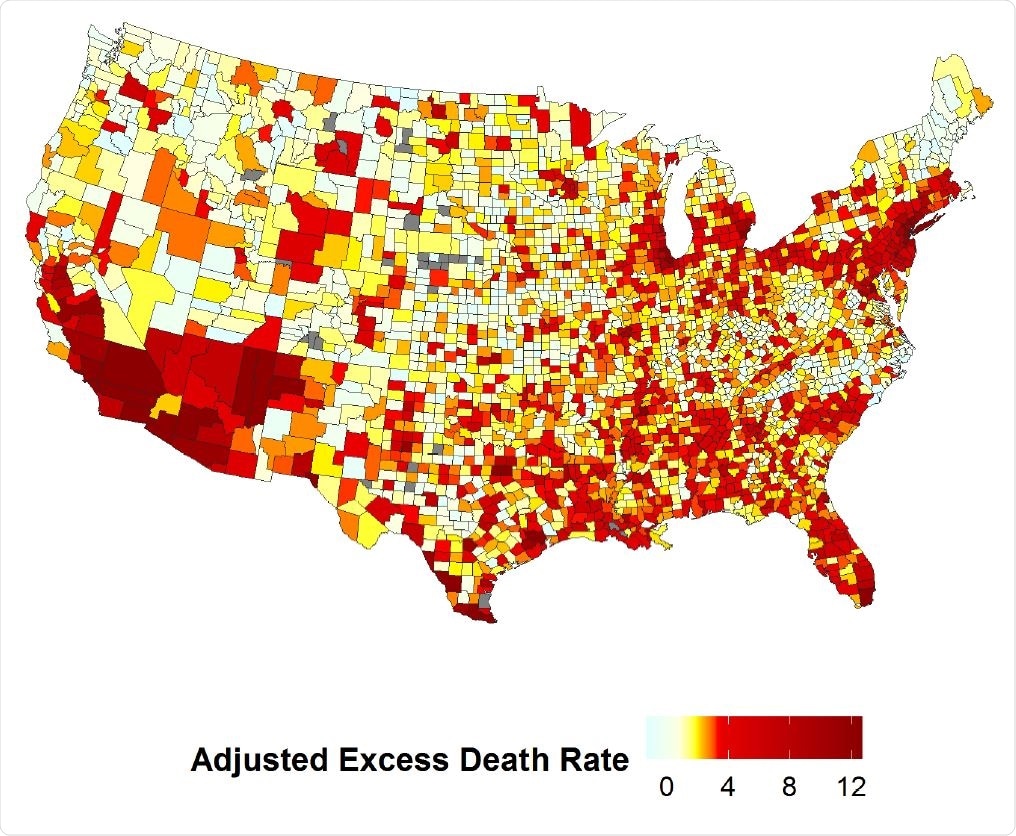
Adjusted Excess Death Rate by County. Heat map of adjusted excess death rate by county. The adjusted excess death rate is defined as the excess death rate divided by the standard error of the prediction for a given county and year. Note that estimates for counties in North Carolina may be unreliable due to reporting lags.
Excess deaths not assigned to COVID-19
New York City counties — Bronx, Queens, and Kings County — reported a high number of excess deaths not attributed to COVID-19 and the highest directly assigned COVID-19 death rates.
Some counties, including Middlesex County in Massachusetts and Kings County in Washington, were predicted to have low excess death rates, suggested that mortality cases directly assigned to COVID-19 were more significant than the excess death rate.

 This news article was a review of a preliminary scientific report that had not undergone peer-review at the time of publication. Since its initial publication, the scientific report has now been peer reviewed and accepted for publication in a Scientific Journal. Links to the preliminary and peer-reviewed reports are available in the Sources section at the bottom of this article. View Sources