Phylogenetic analysis of the severe acute respiratory syndrome coronavirus 2 (SARS-CoV-2), which is the agent responsible for the coronavirus disease 2019 (COVID-19), is crucial to detecting emerging variants around the world. However, due to the rapid input of millions of viral genomes, this time-consuming analysis is being overstretched.
 Study: CoVizu: Rapid analysis and visualization of the global diversity of SARS-CoV-2 genomes. Image Credit: Tartila / Shutterstock.com

 This news article was a review of a preliminary scientific report that had not undergone peer-review at the time of publication. Since its initial publication, the scientific report has now been peer reviewed and accepted for publication in a Scientific Journal. Links to the preliminary and peer-reviewed reports are available in the Sources section at the bottom of this article. View Sources
The researchers then incorporated all genomes that have identical features into variants and found the symmetrical differences between the sets of mutations for paired variants. This was used as the basis on which a phylogenetic tree was constructed, with short or low support value branches being integrated into one that is mapped as an ancestral variant.
Through the use of this approach, a little over 1.5 million genomes can be analyzed in about nine hours. This analysis then constructs a tree representation with variants shown as horizontal lines and beads showing each sample by its date of collection.
Background
Among the outstanding developments during this pandemic has been the extensive and swift sharing of genomic information about SARS-CoV-2. On the Global Initiative for Sharing All Influenza Data (GISAID) database alone, there are now over two million SARS-CoV-2 sequences.
By sharing this information, researchers around the world are able to complete phylogenetic analysis of the virus in an effort to help trace its divergence at local and global levels. One such tool is Nextstrain, which produces interactive visualizations of the diversity of this virus. Despite its utility, Nextstrain can only contain about 3,000 sequences in its computational base for each visualization as a result of limitations on the complexity of the calculation and the scale of the drawing.
With large phylogenies, the number of possible trees increases at a rate beyond exponential. Again, the virus spreads faster than it mutates, such that source and new infections share the same genome. Sequencing errors and missing genomic data are also often encountered, which further contributes to confusion surrounding the precise nature of the phylogeny.
Visual representation is also difficult because all samples with identical sequences form part of the same node, even though they come from different periods and locations, with different epidemiological significance. These differences can be represented in other ways; however, the methods used to do this are very complex and demand high computational power.
Presenting CoVizu
The current paper deals with CoVizu (derived from ‘coronavirus visualization’), which is a current project operating in the public domain comprised of a Python-based backend and a JavaScript-based ‘frontend.’ The backend consists of an analytical process to tease out evolutionary relationships, which is comparable to the frontend, which is a visual representation of such relationships.
CoVizu offers visual mapping of lineage relationships using the Pango lineage system.
How CoVizu works
The raw sequences used here, which are assigned to a Pango lineage, have a specified length and have been labeled with the date, month, and year of collection. All filtered data is then aligned against the SARS-CoV-2 reference genome.
The resulting sequence alignment/map (SAM) output is processed to remove all mutations and genetic divergences from the reference strain. The set of features for each genome serves as a compact label.
Any problematic sites or other specified exclusion criteria were investigated before constructing a time-scaled phylogenetic tree based on the earliest valid sample of each lineage. All insertions are first removed to get a multiple sequence alignment of these early samples.
Tree construction and clustering analysis
Subsequently, a maximum likelihood tree is developed, the scale is changed using a predefined mutation rate of 8x10⁻⁴ substitutions/site/year. Clustering analysis was performed by the neighbor-joining method, which shows the relationship between various genomes in terms of which came first and how others are derived from the earlier strains.
Some adaptations used at this point to prevent overtaxing computational memory, and ensure that insertion-deletion mutations are included, are forming variants, comprising all genomes with identical sets of features. The symmetric difference is estimated per paired variant set, for feature sets. This is the sum of all terms found in either of the variants, but not both.
Further processing is used to arrive at a bootstrap replicate, processing rarer lineages together and more commonly sampled ones separately.
Finally, a consensus tree is generated, containing all the splits that were present in half or more of the bootstrap trees, with branch lengths assigned as averages of the lengths in all the trees that show each split. If the average length is below 0.5 mutations, the branch is collapsed.
For terminal collapsed branches, the variant label is mapped to the internal node directly, while for internal branches, in the same circumstances, the variant is mapped to its parent. This allows the same internal node to be linked to more than one variant.
The labeled internal nodes are thus considered to be ancestral or parental variants that have been found in a genome sequence. The final tree is converted into a JSON file, with node lists and edge lists consisting of sample labels according to a variant, and paired ancestral-new variants, with branch lengths and bootstrap support values.
Visual representation
The visualization of this data is as a single webpage that contains a time-scaled tree relating Pango lineages, along with a bead plot that shows variations within any given lineage. The program also allows each individual sample to be shown for any given lineage, variant, or bead.
The tree can be set to show the number of samples that are sorted from newest to oldest, mean deviation from the molecular clock, or sampling location by region. Hovering the mouse over any of the rectangular elements on the tree brings up a summary of the lineage-related statistics and all mutations that are seen in half or more of the samples.
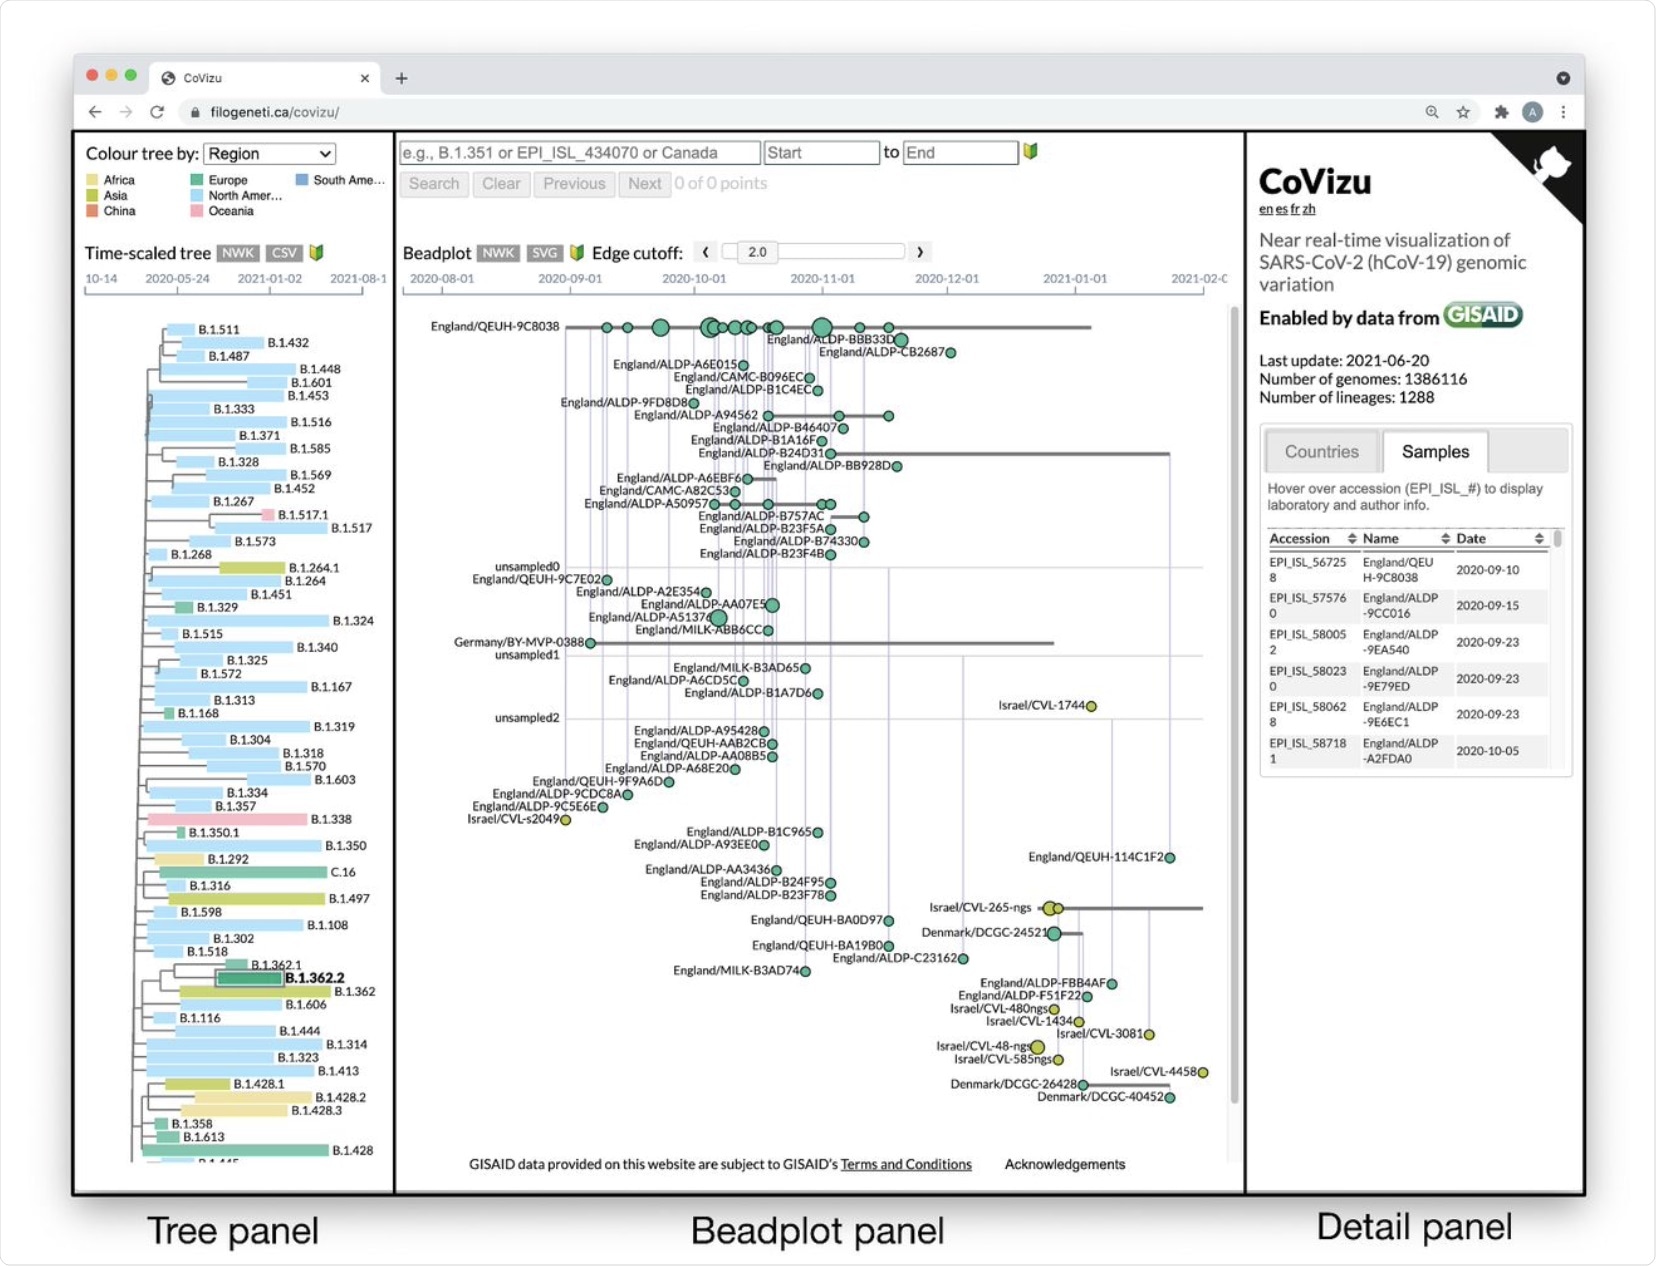
 The CoVizu front-end presented as a single webpage at https://filogeneti.ca/CoVizu. Visual information is arranged into three panels (emphasized with rectangular boxes and labels) to present the data at decreasing levels of granularity from left to right. The leftmost panel displays a time-scaled tree relating Pango lineages, coloured by geographic region in this instance. Selecting a lineage updates the middle panel to display a beadplot of its variants and samples. In this example, we have selected lineage B.1.362.2, which was sampled predominantly in Europe and comprised 99 samples grouped into 59 variants. The rightmost panel depicted here displays a scrollable table of sample accessions, names, and collection dates.
The bead plots try to highlight mutations of public health concern, with larger beads representing a greater number of samples collected on the same day and the color representing the region that provided most of the samples. This format makes it easier to sense how frequently a variant of interest behaves over time.
Imported infections can be identified by observing the same or very similar variants in different regions. Variants that have not been sampled but are thought to exist, judging from the common ancestry of other variants, are represented by horizontal line segments without beads.
The panel at the right side of the three-part webpage shows sample details. A search box is also present.
What are the implications?
“The standard phylogenetic toolkit is not up to the task of processing the overwhelming number of publicly accessible viral genomes. CoVizu is under continual development. We welcome suggestions for additional features, with the hope that this rapid analysis and visualization system can provide a unique, useful resource for public health monitoring and basic research.”

 This news article was a review of a preliminary scientific report that had not undergone peer-review at the time of publication. Since its initial publication, the scientific report has now been peer reviewed and accepted for publication in a Scientific Journal. Links to the preliminary and peer-reviewed reports are available in the Sources section at the bottom of this article. View Sources