Researchers in the United States have studied changes in contact rate patterns in the United States over the course of the coronavirus disease 2019 (COVID-19) pandemic and modeled the impact that these changes have had on the incidence of cases across different age groups.
The team – from Harvard TH Chan School of Public Health in Boston, Massachusetts, and the University of California in Berkeley – found that the average number of contacts reported across six waves of the Berkeley Interpersonal Contact Survey steadily increased from March 2020 to September 2020.
The mean contact rates consistently differed across age groups, with 18 to 34 year-olds reporting the highest number of contacts across six metropolitan designated market areas in the United States. By contrast, those aged 65 years or older reported the lowest number of contacts across these localities.
Ayesha Mahmud and colleagues say the findings highlight the role of different age groups in driving and sustaining the transmission of the COVID-19 causative agent – severe acute respiratory syndrome coronavirus 2 (SARS-CoV-2) – in the United States.
The researchers also say that the study reinforces the value of collecting empirical contact rate estimates in order to capture spatial and temporal changes in contact rates and patterns.
A pre-print version of the research paper is available on the medRxiv* server, while the article undergoes peer review.

 *Important notice: medRxiv publishes preliminary scientific reports that are not peer-reviewed and, therefore, should not be regarded as conclusive, guide clinical practice/health-related behavior, or treated as established information.
The importance of interaction patterns in the population
The SARS-CoV-2 virus is primarily spread through close person-to-person contact. The transmission dynamics and subsequent rates of COVID-19 morbidity or mortality are therefore dependent on interaction patterns in the population.
Age-specific contact patterns are particularly relevant since susceptibility to SARS-C0V-2 infection and COVID-19 clinical outcomes vary by age.
However, Mahmud and colleagues say that surprisingly few empirical estimates of age-structured contact rates in the United States are available.
There have been considerable differences across the country in terms of both COVID-19 cases and in the types of non-pharmaceutical interventions (NPIs) adopted.
Therefore, quantifying the variation in contact rates between cities over time is key to understanding spatial and temporal variations in contact patterns, the infection burden by age and demographics, and the effectiveness of physical distancing policies, say the researchers.
The ongoing Berkeley Interpersonal Contact Survey (BICS) has so far consisted of six waves of surveys that have collected comprehensive contact data in the United States throughout the course of the pandemic, including respondents’ total number of contacts and those contacts’ demographic information.

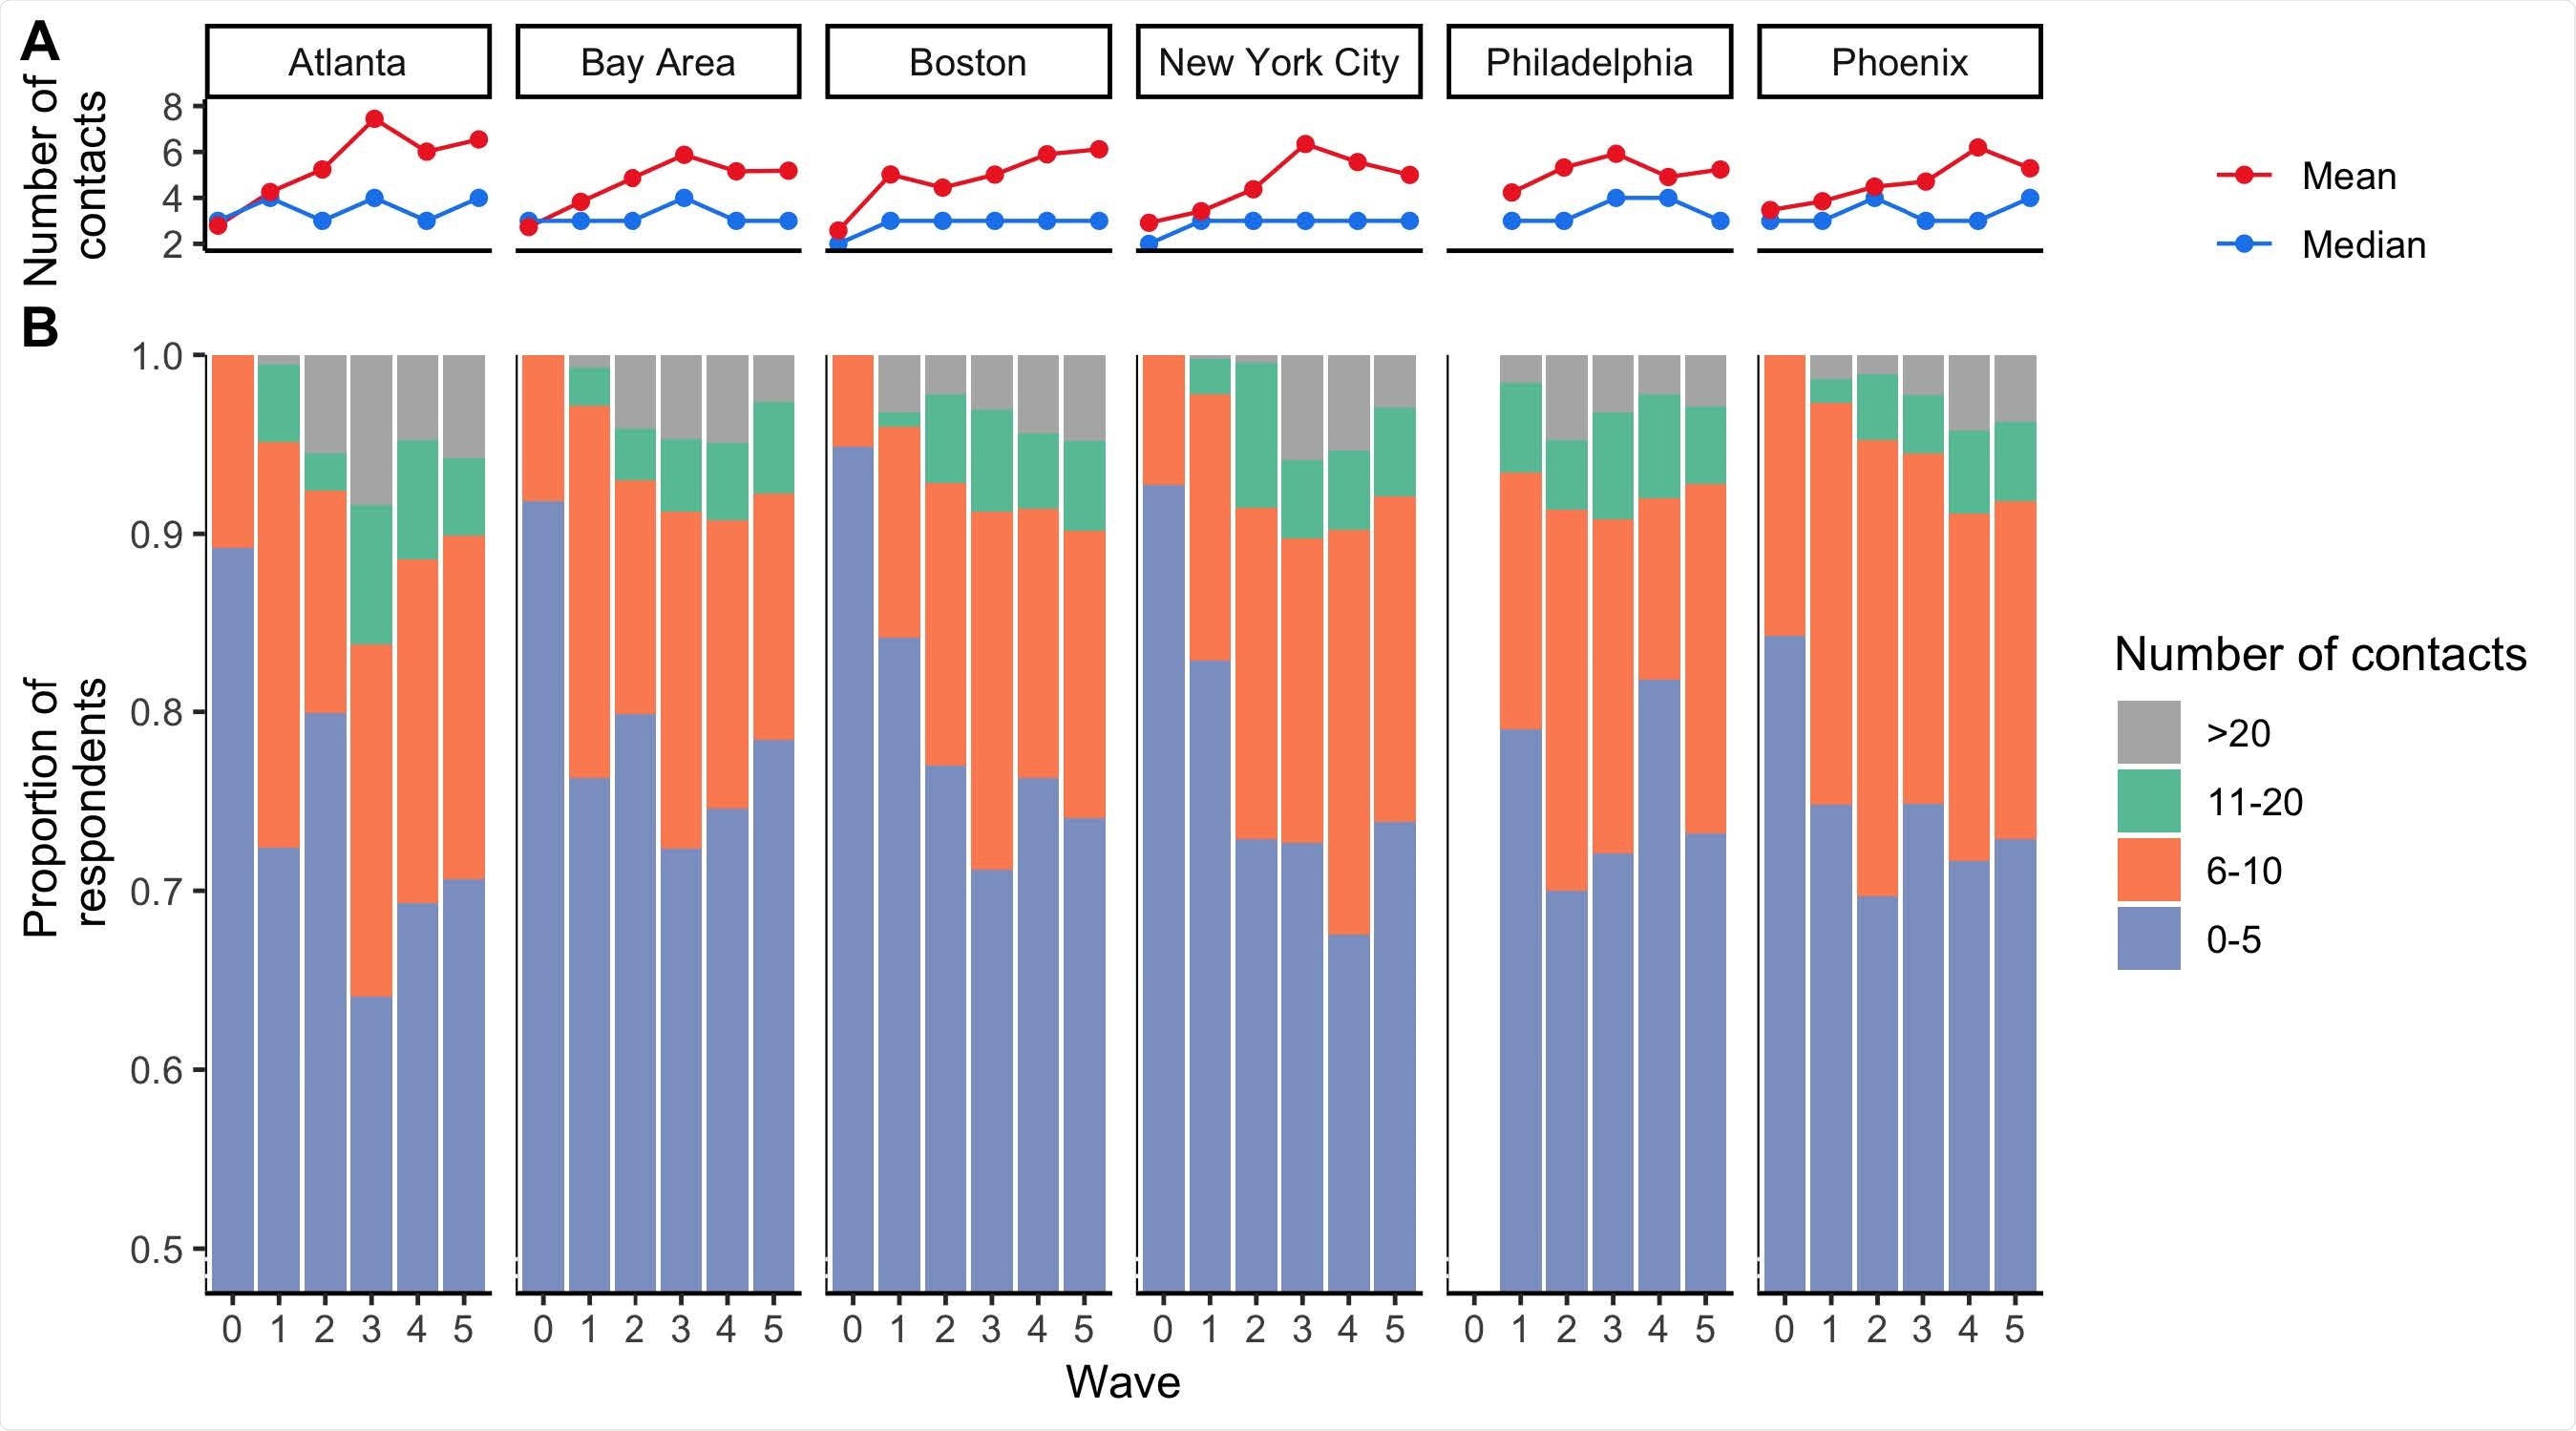
Descriptive analyses of the number of contacts estimated for the 6 DMAs across BICS Waves 0-5. A) Mean number of contacts (red line) and median number of contacts (blue line) reported during survey Waves 0-5 in each DMA in the BICS study. B) Proportion of BICS respondents reporting 0-5, 6-10, 11-20, and >20 contacts during survey Waves 0-5 in each DMA of the BICS study. The y-axis is truncated and begins at the value 0.5.
What did the researchers do?
The team comprehensively analyzed data from the six waves of the BICS study conducted between March 22nd, 2020, and February 15th, 2021, across six metropolitan designated market areas (DMAs) surrounding Atlanta, the San Francisco Bay Area, Boston, New York City, Philadelphia, and Phoenix.
Overall contact patterns across the six DMAs were quantified over time and then used to parameterize an age-structured mechanistic model of SARS-CoV-2 transmission to understand changes in age-specific disease burden.

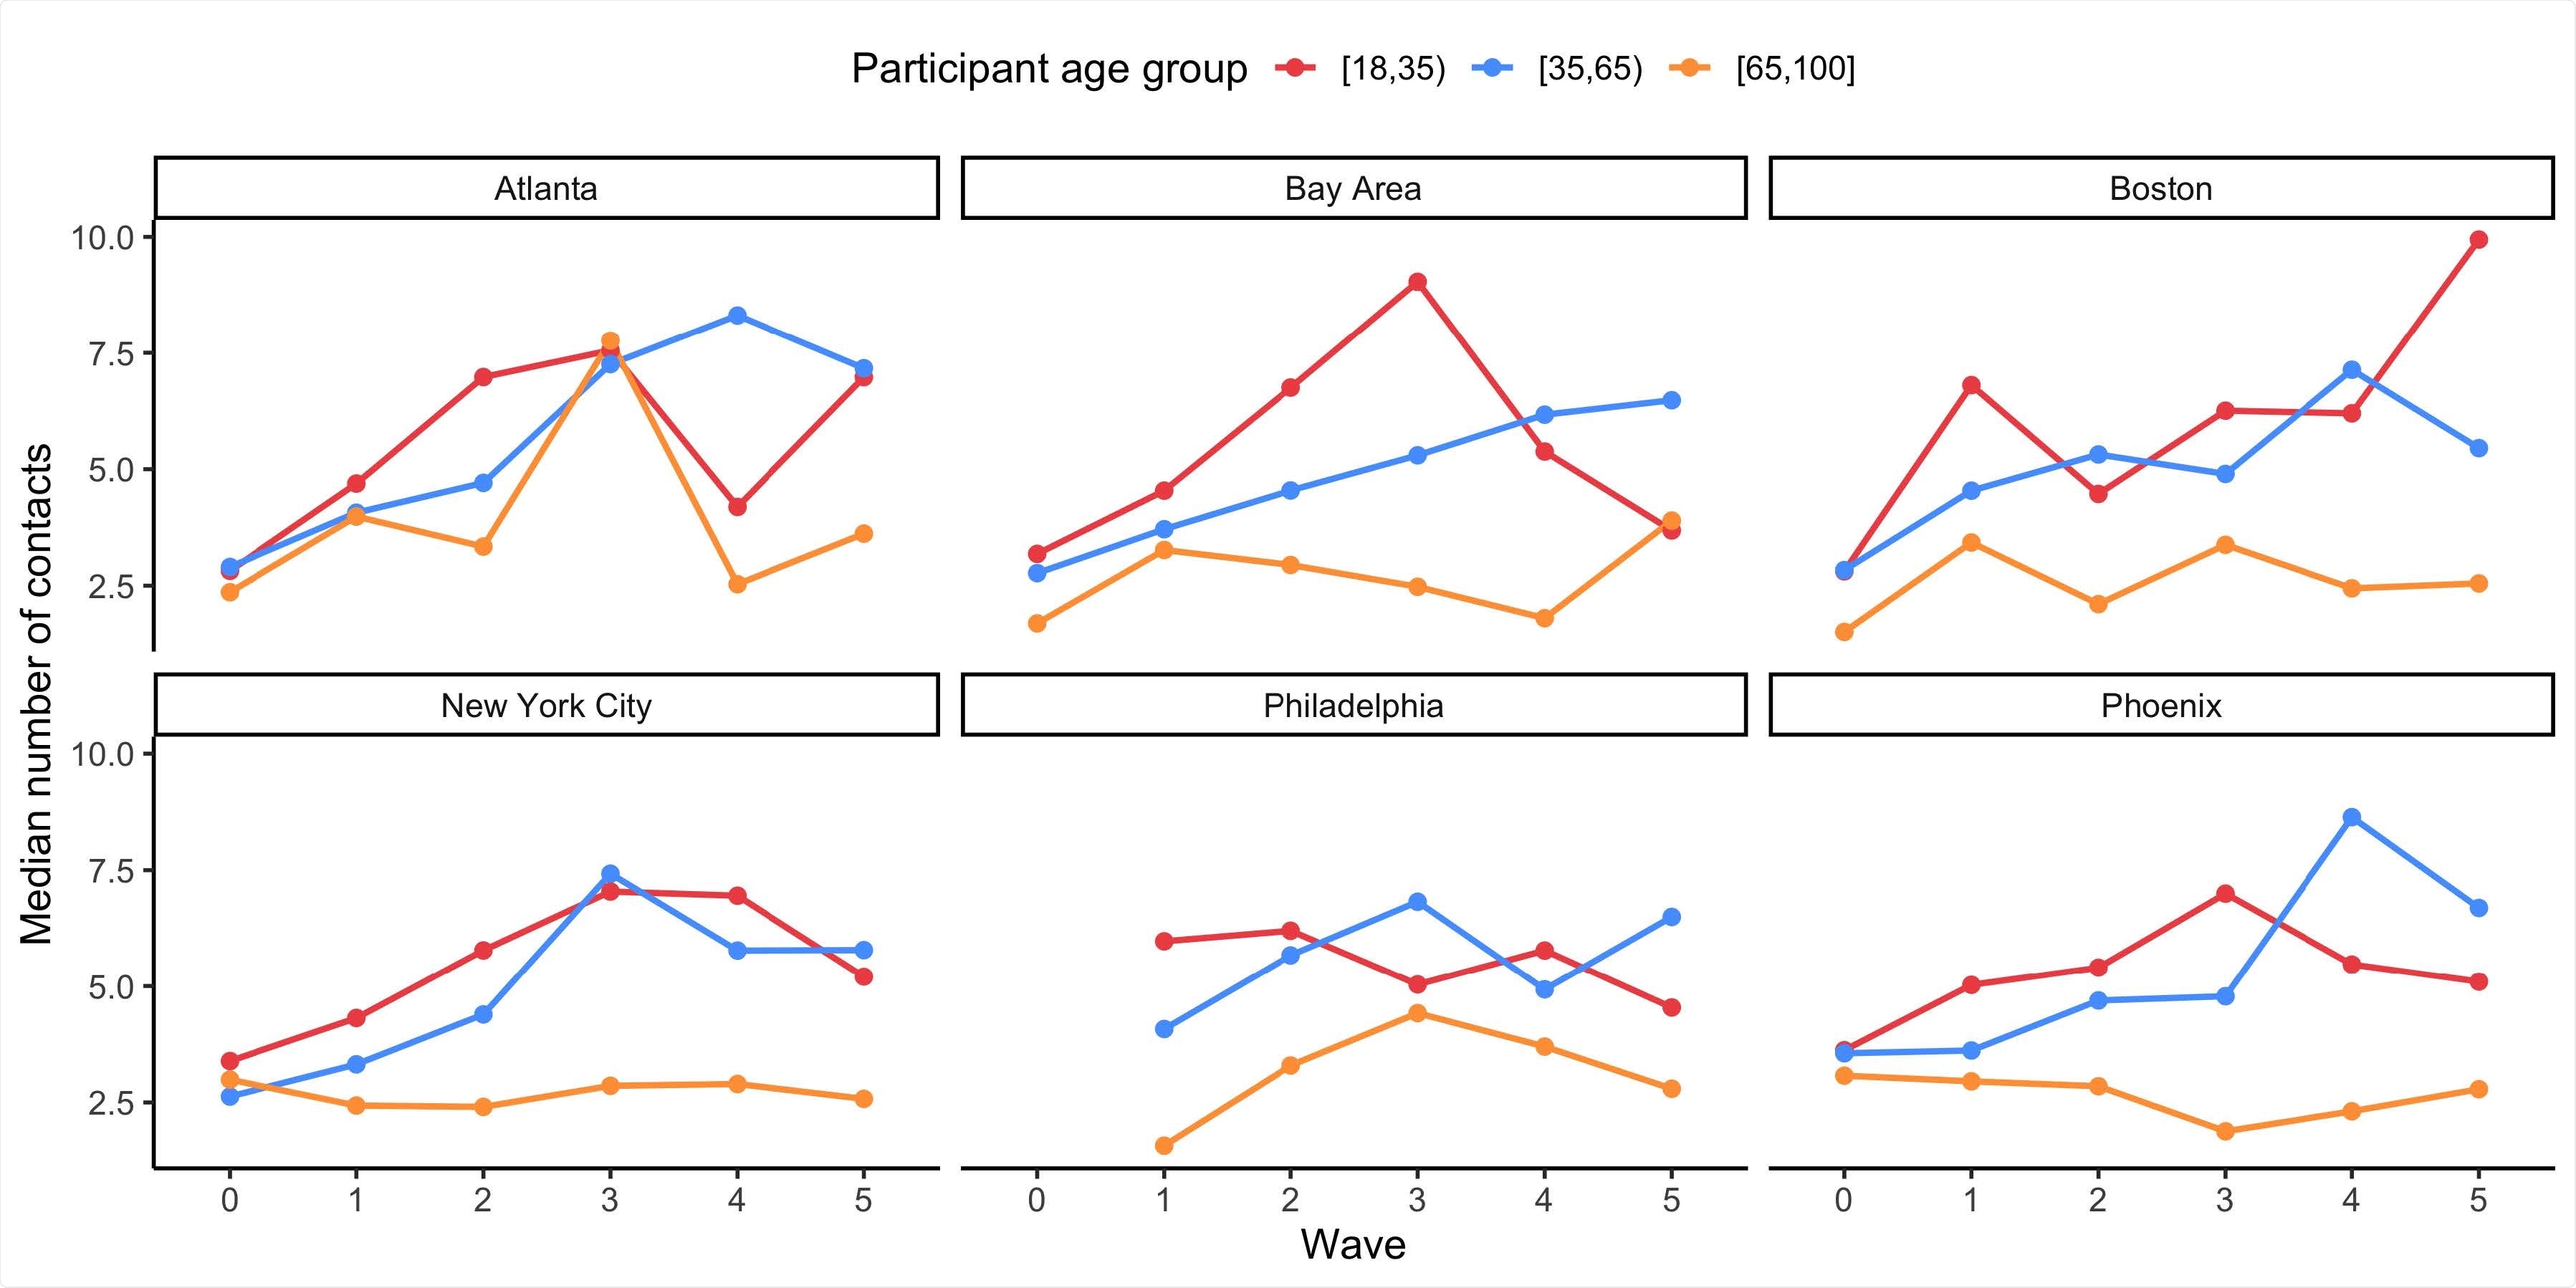
The mean number of contacts reported by BICS participants aged 18-34, 35-64, and 65+ years old during survey Waves 0-5 in each DMA of the BICS study.
What did the study find?
Despite differences in COVID-19 trajectories and the NPIs enforced across the DMAs, similar dynamics in the number of reported contacts were observed across the localities.
The mean number of contacts and the proportion of respondents reporting a high number of contacts steadily increased over time.
Across all DMAs, 18 to 34 year-olds consistently reported the highest mean number of contacts, compared with other age groups.

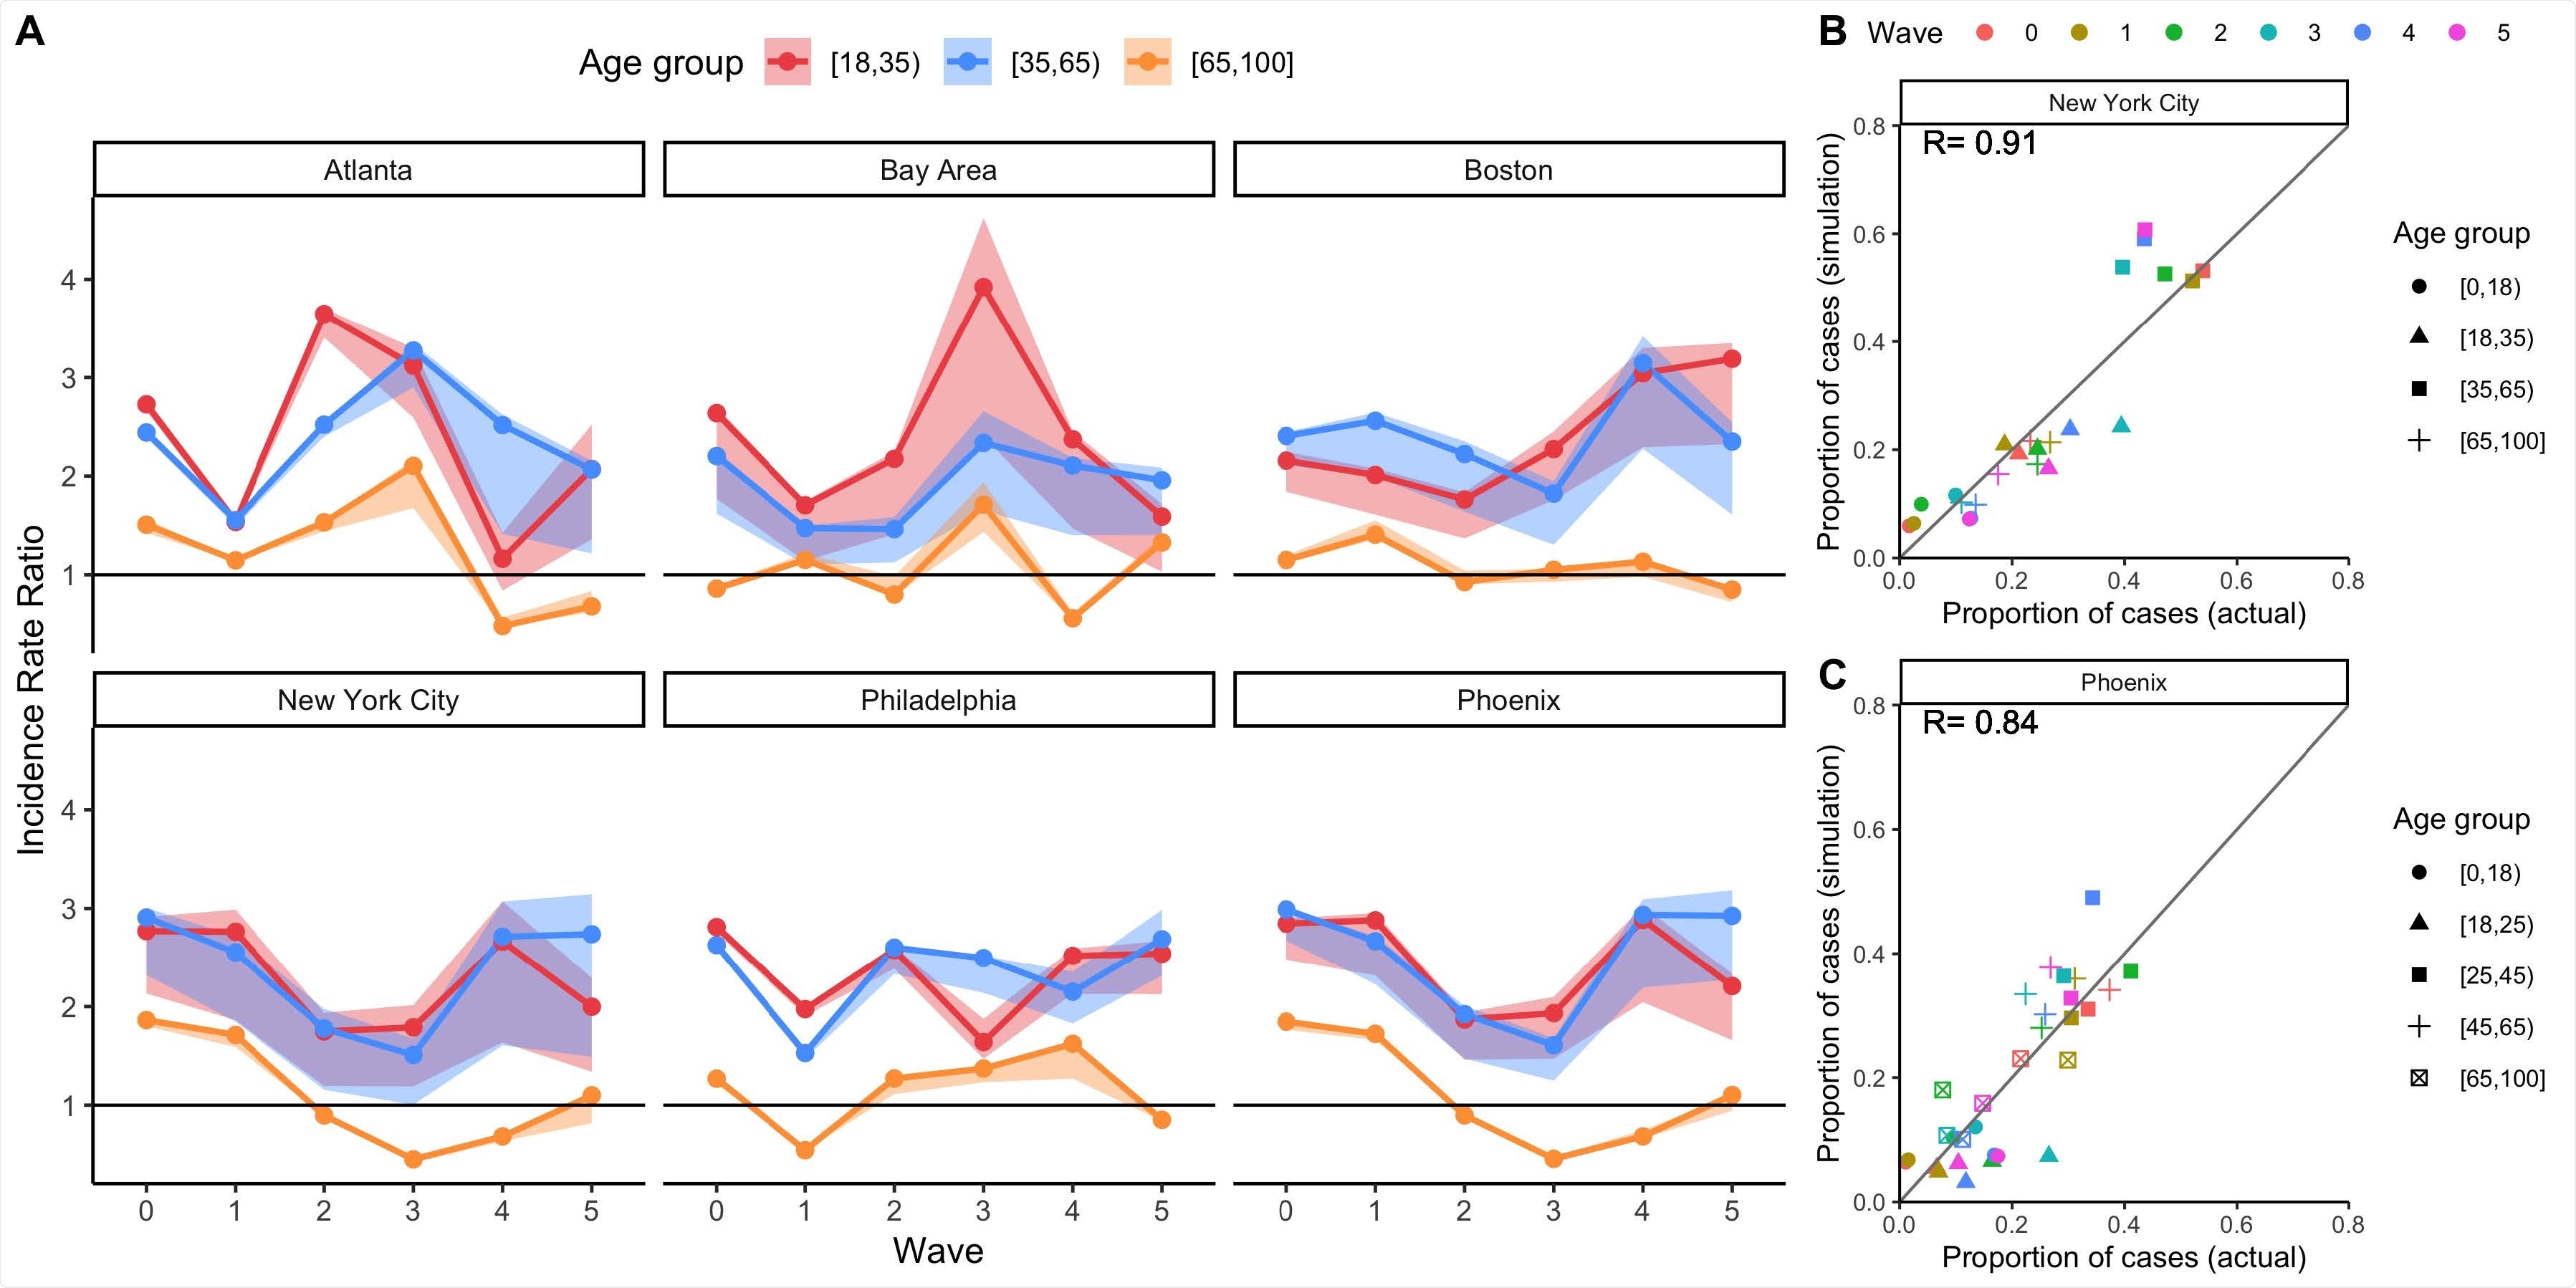
Mechanistic model results of total incidence for four age groups using BICS contact rate data, with comparisons to observed data where possible. A) Simulated incidence rate ratio (IRR) representing total incidence for each DMA and BICS survey wave comparing 18-34, 35-64, and 65+ year olds to the reference age group of 0-17 year olds. 90% uncertainty bounds are estimated from running 1,000 simulations with 1,000 different values of R0. The mathematical model is parameterized using empirical contact rate estimates from the BICS study. B) Scatterplot comparing the proportion of COVID-19 cases in each age group (represented by symbol shape) and survey wave (represented by symbol color) estimated in the simulation based on clinical incidence vs. reported in actual epidemiological data for New York City. The empirical data for New York City represent the proportion of positive COVID-19 molecular tests by age group for New York City. C) Scatterplot comparing the proportion of COVID-19 cases in each age group (represented by symbol shape) and survey wave (represented by symbol color) estimated in the simulation based on clinical incidence vs. reported in actual epidemiological data for Phoenix. The empirical data for Phoenix represent the proportion of confirmed and probable COVID-19 cases reported in Maricopa County.
In particular, the mean number of contacts reported by this age group in the Bay Area increased from 3.2 in the first survey wave (March 22nd to April 8th) to a peak of 9.0 in the third (September 11th to 26th).
By contrast, those aged 65 years or older consistently reported the lowest mean number of contacts, compared with other age groups, across time and DMAs.
The impact on COVID-19 incidence
Those in the 18–34 and 35–64-year-old age groups had a higher total incidence of COVID-19 relative to the reference group (0 to 17 year-olds), across DMAs and time.
Despite those aged 65 years or older having a higher susceptibility to infection relative to other age groups, they had a comparable or lower total incidence of COVID-19 relative to younger age groups as a result of their substantially lower mean contact rates.
Further BICS survey waves will continue to provide invaluable information
Mahmud and colleagues say that the contact rate estimates provided by the BICS study offer unique insights into how age-structured contact patterns have changed across time and localities in the United States during the COVID-19 pandemic.
Since the BICS is an ongoing effort, data from further survey waves will continue to provide invaluable information regarding how contact rate patterns will change as the pandemic evolves.
“Examining whether and when contact rates return to pre-pandemic levels, and understanding the relationship between contact rates and NPIs for SARS-CoV-2 and other respiratory pathogens, are key directions for future research,” they conclude.

 *Important notice: medRxiv publishes preliminary scientific reports that are not peer-reviewed and, therefore, should not be regarded as conclusive, guide clinical practice/health-related behavior, or treated as established information.