Since it was first detected in Wuhan, China, the severe acute respiratory syndrome coronavirus 2 (SARS-CoV-2) has spread rapidly across the world causing major damage to global health and economics. The coronavirus disease 2019 (COVID-19), which is caused by SARS-CoV-2 infection, is considered to be the third most pathogenic coronavirus after SARS-CoV-1 and the Middle East respiratory syndrome coronavirus (MERS-CoV).
The most severe complications associated with COVID-19 include sepsis, severe pneumonia, multiple organ dysfunction (MOD), acute respiratory syndrome (ARDS), and acute lung injury (ALI). Overactivation of the immune system resulting in a cytokine storm is the mechanism of ARDS associated with COVID-19 and is thought to be the leading cause of death.
 Study: Mapping Molecular Gene Signatures Among Respiratory 2 Viruses Based on Large-Scale and Genome-wide 3 Transcriptomics Analysis. Image Credit: Sergey Chips / Shutterstock.com

 This news article was a review of a preliminary scientific report that had not undergone peer-review at the time of publication. Since its initial publication, the scientific report has now been peer reviewed and accepted for publication in a Scientific Journal. Links to the preliminary and peer-reviewed reports are available in the Sources section at the bottom of this article. View Sources
In a recent study published on the preprint server bioRxiv*, researchers from Lancaster University, United Kingdom, compared a large cohort of transcriptomic dataset maps of gene regulation by SARS-CoV-2 infection and the additional impact of other respiratory viruses such as rhinovirus, respiratory syncytial virus (RSV), and SARS-CoV-1.
Study findings
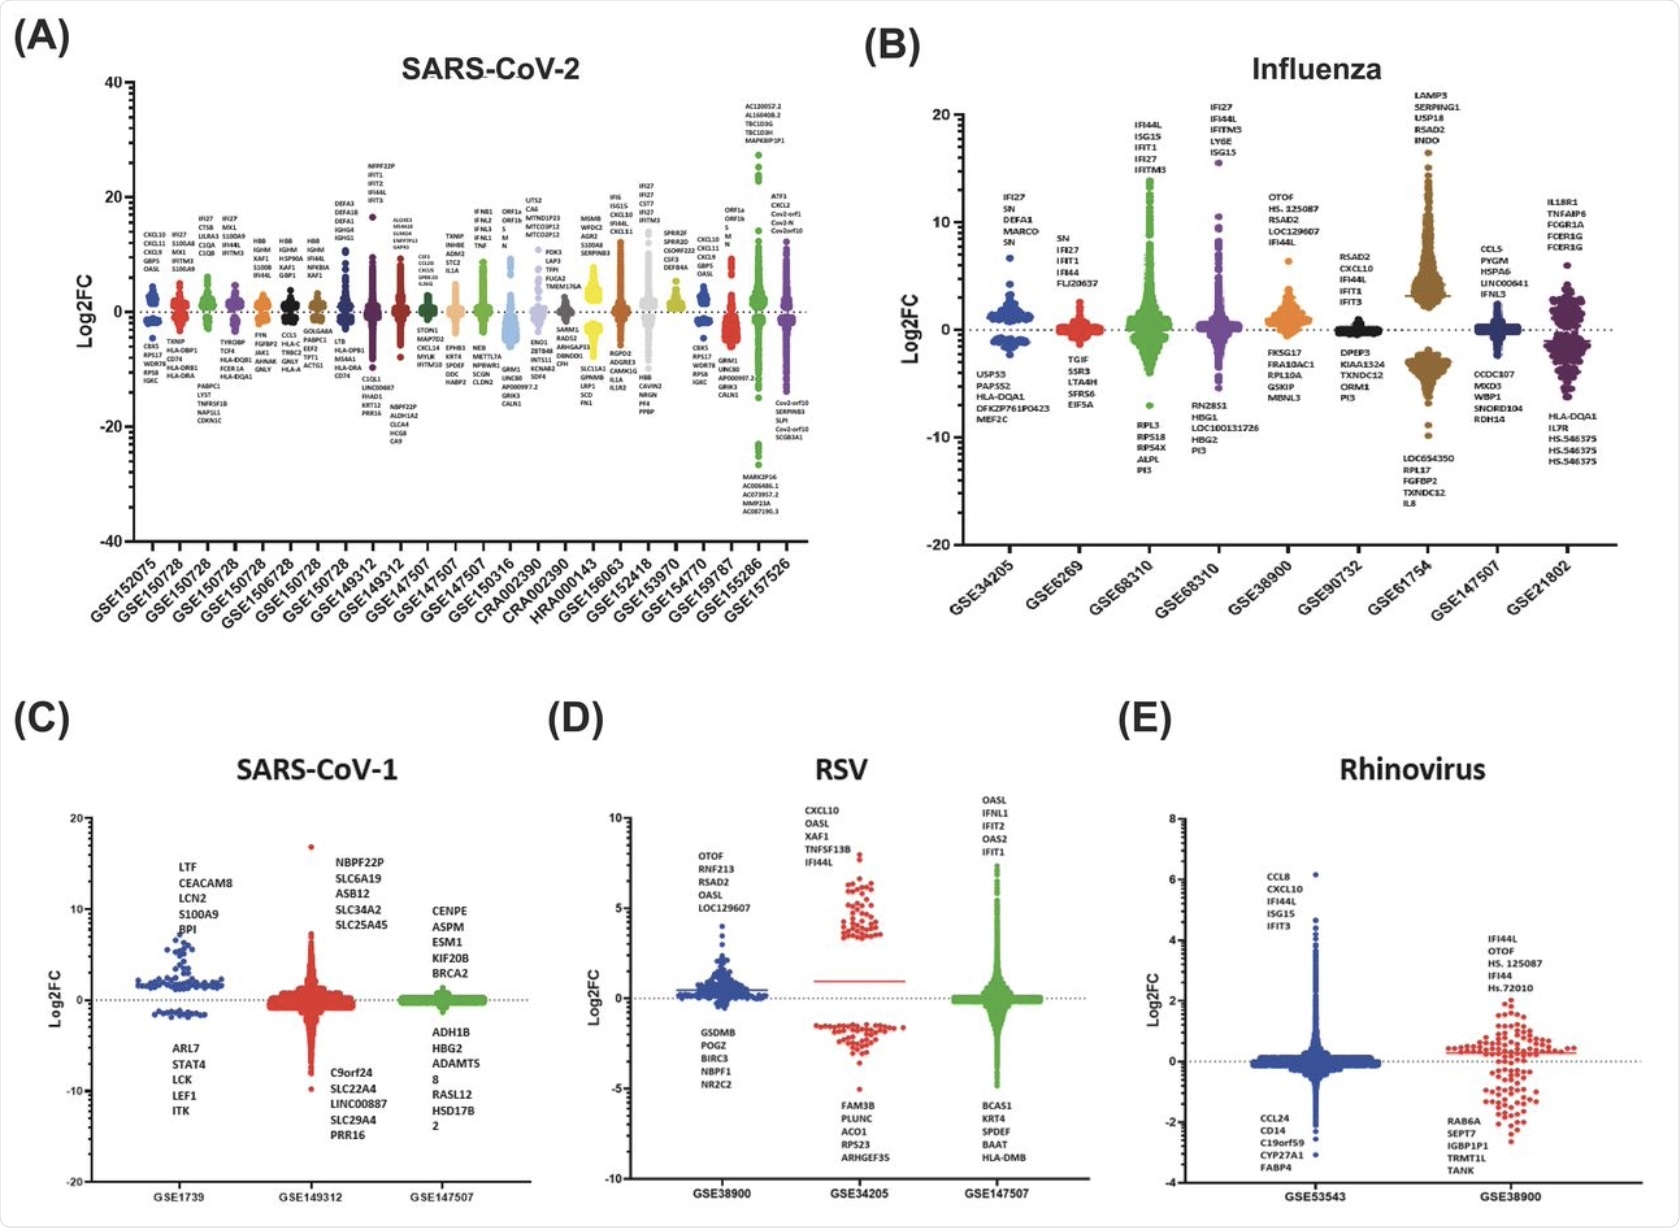
The scatter bar graph for the datasets gathered for the SARS-CoV-2 utilizes the primary fold change values specified by each study, where every bar shows a distinct dataset that displays the up and down-regulation of genes responding to viral infection. Each dataset was unique, displaying various patterns in which the genes of the host were slightly up or downregulated and only a small number that was highly differentially up- or down-regulated. This shows that specific viral infections induce responses from selective genes of the innate immune system.
This scatter bar graph also shows distinct sets of genes that are up or downregulated associated with infection from RSV, SARS-CoV-1, and rhinovirus. As evident in the graph, there is a clear abundance of genes that are slightly differentially regulated with significantly fewer genes at the high fold change values.
Interestingly, for SARS-CoV-1, there were significant differences between the highest and lowest values obtained for log-2-fold change for different datasets.
Additionally, the majority of innate immune genes fall within +10 or -10 log-2-fold change for these viruses. However, SARS-CoV-1 appears to have a specific set of top five upregulated genes in comparison with the other viruses, whereas both RSV and rhinovirus datasets showed the IFI44 gene and CXCL family.
 Scatter bar graphs of the Log-2-Fold Change of each gene for each dataset 535 for the A) SARS-CoV-2, B) Influenza, C) SARS-CoV-1, D) RSV, E) Rhinovirus. A 536 horizontal line is also shown on each bar, which marks the average Log-2-fold 537 change of the selected genes.
Heatmap analyses and gene differences between respiratory viruses
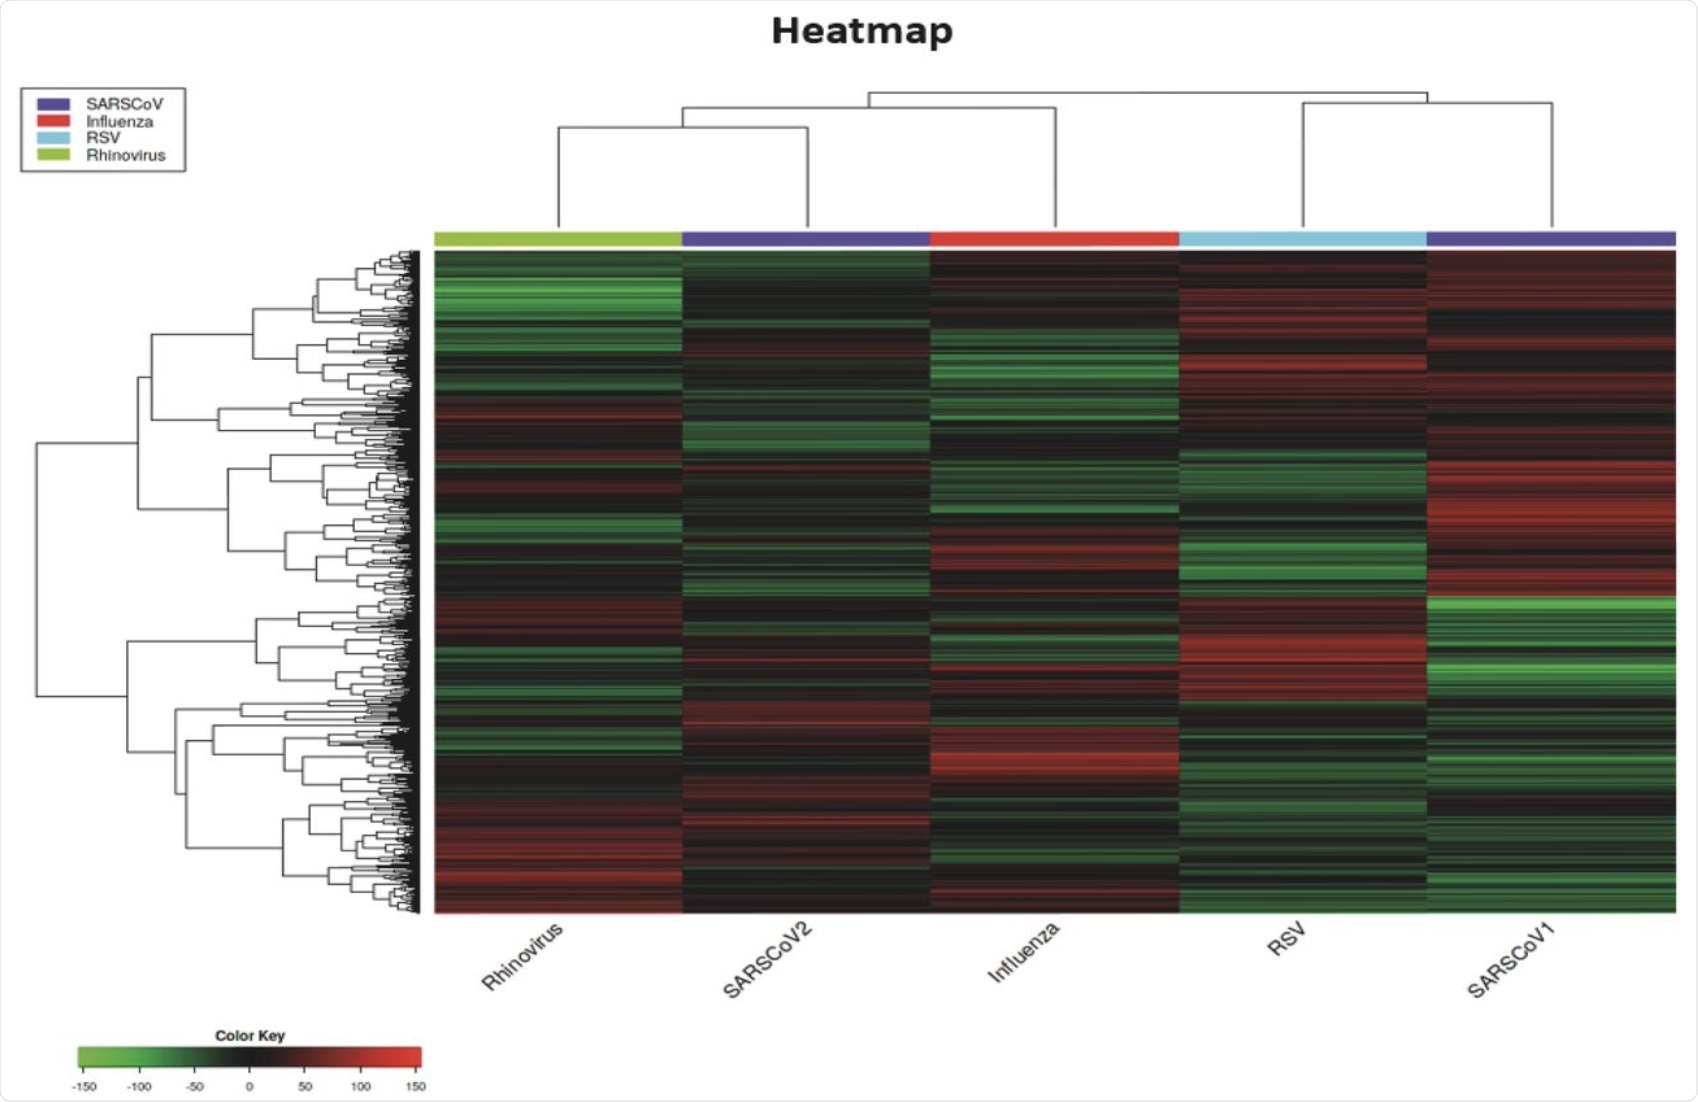
The authors generated a heatmap to provide an analysis of the pathways that are regulated differently by each of the viruses studied. Compared to the other viruses, SARS-CoV-2 appeared to be unique by eliciting distinct viral responses.
Notably, between the genes DDX21 and GBP3 at the base of the heatmap where other viruses had no effect or a mild upregulation of the genes, SARS-CoV-2 appeared to cause down-regulation.
SARS-CoV-1 was possibly the most unique out of all the viruses studied, as the heatmap showed it causing downregulation in large areas, whereas the other viruses were eliciting upregulation.
Also highlighted from the heatmap results are the distinct differences between the viruses. Although these different respiratory viruses can be grouped together regarding their targets within the host, substantial differences were observed in the genes affected by these viruses.
Several different and unique red and green areas for each virus were observed on the heatmap, with very few colored areas being shared with more than two viruses. Surprisingly, SARS-CoV-1 and SARS-CoV-2 displayed the most substantial differences, with almost no colors in common. However, the only virus that exhibited both up- and downregulated genes in two specific areas was SARS-CoV-1.
 Heatmap of DEGs for all the respiratory viruses studied in this analysis.
Implications
The authors conducted this study to determine how SARS-CoV-2 influences immune regulation and gene induction when compared to other respiratory viruses. The results showed that SARS-CoV-2 appeared to be unique in its impact on gene regulation in comparison with the other studied viruses except for RSV. In SARS-CoV-2, the genes NFKBIL1 and MAP2K5 were found to be greatly upregulated, while in the other viruses these genes were downregulated.
There were several limitations noted about this study by the authors, including that the length of time post-infection may affect gene regulation, phenotypes of the cells, the conditions in which the cells were cultured, and the nature of virus stimulation. Also, the different cell lines that were used in this study may respond differently to the different viral infections.

 This news article was a review of a preliminary scientific report that had not undergone peer-review at the time of publication. Since its initial publication, the scientific report has now been peer reviewed and accepted for publication in a Scientific Journal. Links to the preliminary and peer-reviewed reports are available in the Sources section at the bottom of this article. View Sources