Understanding the factors that influence the airborne survival of viruses such as severe acute respiratory syndrome coronavirus 2 (SARS-CoV-2) in aerosols can help identify transmission routes and the effectiveness of various prevention strategies.
There has been an ongoing debate regarding the airborne transmission of SARS-CoV-2, which has massively affected the non-pharmaceutical mitigation strategies that include the use of facemasks, social distancing, or ultraviolet germicidal irradiation.
The majority of the studies have indicated that the SARS-CoV-2 virus is transmitted when a healthy individual comes in close contact with an infected individual. However, some studies have also documented that virus transmission occurs in preventable circumstances, such as poorly ventilated rooms.
A detailed understanding of the process that keeps the virus active in the air or if the infectivity is influenced by environmental conditions, such as relative humidity (RH) and temperature, has not yet been documented.
Not many studies are available that discuss the impact of environmental conditions on the microenvironment within an airborne droplet. Additionally, there is a gap in research regarding the relationship between the microenvironment within airborne droplets and the stability of pathogens.
How the Microenvironment Influences Aerosols?
Scientists have stated that as the microenvironment within an airborne droplet is multifarious, it is incredibly complicated to analyze. Typically, aerosols containing respiratory pathogens are exhaled out or produced while talking or coughing and are 100 nm to 100 µm in diameter.
Previous studies have revealed that the surrounding RH impacts the equilibration of the water activity within the aerosols containing microbes.
In most conditions, the exhaled aerosol droplets lose both heat and moisture via evaporation. This leads to an increased solute concentration, and subsequently, these supersaturated solutes get crystallized and form dry particles under low RH conditions.
The physicochemical conditions of the droplet’s surface may differ from its core. The moisture content of the aerosol decreases to establish equilibrium with the environment. Steady-state microphysical properties can regulate the survival of the microbes trapped in an aerosol.
Previous studies have indicated that high salinity conditions can eliminate the virus by disrupting the viral RNA. Additionally, these studies have also indicated that high organic macromolecule contents or the formation of amorphous particles containing trapped moisture could enhance the longevity of trapped viruses or bacteria.
Scientists have also revealed that the pH of an aerosol is dependent on its size, composition, and RH.
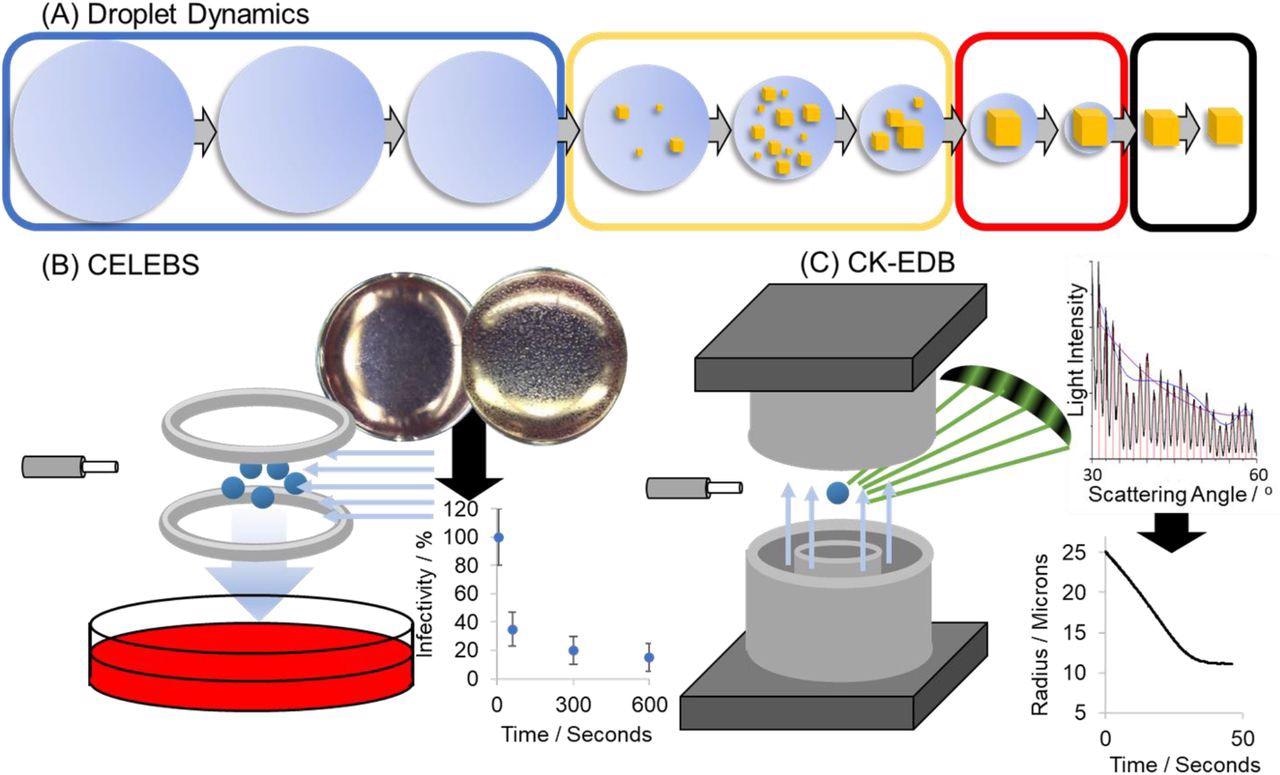
Different techniques have been designed to characterize aerosols. For instance, the stability of viruses and bacteria in an aerosol is examined via the CELEBS technique (Controlled Electrodynamic Levitation and Extraction of Bioaerosols onto a Substrate). In addition, the dynamic changes in the physicochemical properties of droplets can be assessed using Comparative Kinetic-Electrodynamic Balance (CK-EDB).
A New Study
A new study, posted to the medRxiv* preprint server, has focused on the survival of SARS-CoV-2 in airborne droplets of cell culture medium.

(A) Schematic of the physical changes that take place when an airborne aqueous droplet equilibrates to the surrounding relative humidity. On the left (blue box) the particle is an aqueous homogenous sphere. As the particle equilibrates to a sub-saturated RH, low-solubility solutes can precipitate inclusions within the droplet (yellow box). At a sufficiently low RH, the dominant solute (NaCl) can crystallize causing the particle to effloresce (black box). (B) Schematic of the CELEBS technique. Virus-containing particles are levitated under controlled conditions and then deposited into media which is then plated onto a cell culture. By enumerating the cytopathic effect from that deposition, the amount of virus present can be quantified. (C) Schematic of the CK-EDB technique. Particles generated by the same droplet dispensers used in CELEBS are levitated under controlled conditions in the path of a laser. The physical changes that take place in that particle are studied through analysis of the light scattered by that particle.

 This news article was a review of a preliminary scientific report that had not undergone peer-review at the time of publication. Since its initial publication, the scientific report has now been peer reviewed and accepted for publication in a Scientific Journal. Links to the preliminary and peer-reviewed reports are available in the Sources section at the bottom of this article. View Sources
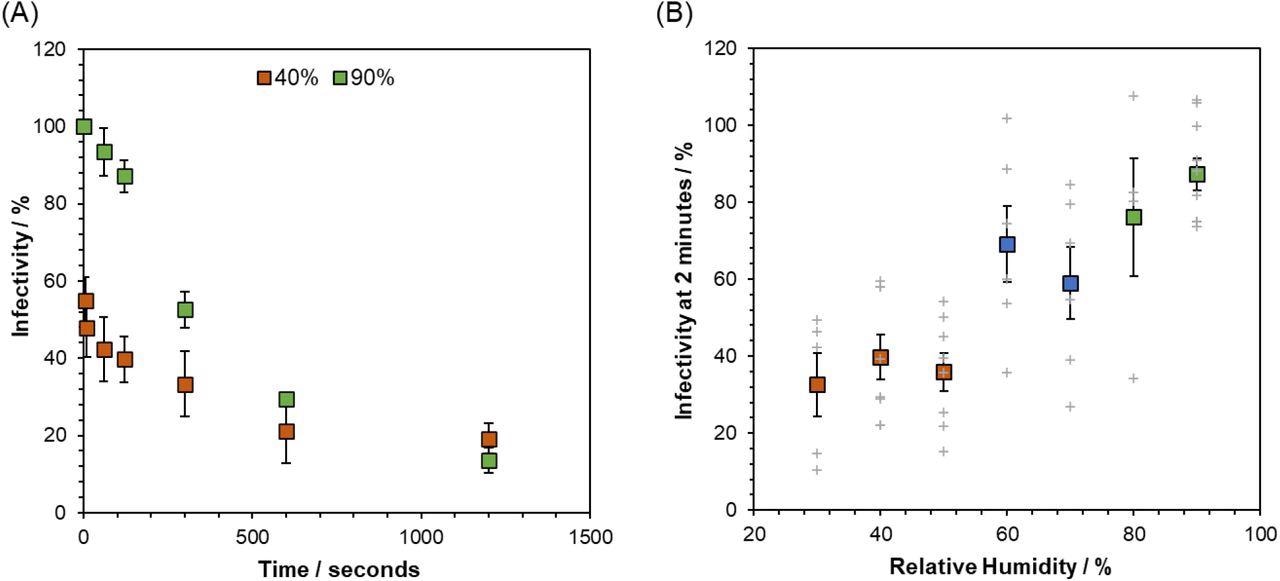
Scientists have also investigated the survival of the virus over timescales spanning from <20 seconds, which corresponds to the evaporation time of freshly exhaled aerosol, through to 20 minutes. Researchers explored the physicochemical changes that occur in the droplet and analyzed how these changes affect the infectivity of the virus.
Previous studies have shown that the half-life of the SARS-CoV-2 virus in the aerosol phase is between 1-2 hours. However, the current study reported an initial rapid decrease in infectivity within a few seconds to minutes of aerosol generation. In addition, researchers have reported that SARS-CoV-2 is inactivated within 10 minutes of aerosolization in most cases. However, more research is required to evaluate how long the infectivity persists, depending on the viral load of the aerosol.

The Short-Term Airborne Decay of SARS-CoV-2. Datapoints are the mean of several measurements (typically >4) and error bars show the standard error. Measurements were carried out at room temperature 18 – 21°C. (A) The percentage infectivity of SARS-CoV-2 REMRQ0001 as a function of time levitated in CELEBS at 40% RH (orange) and 90% RH (green). (B) Curve showing the impact of RH on the percentage infectivity of SARS-CoV-2 REMRQ0001 after 2 minutes of levitation in CELEBS. The larger colored square points show the mean, with the error bars showing the standard error. Grey crosses show the results of individual measurements.
Scientists explained that although they have not measured high-time resolution infectivity using artificial or natural saliva, they used culture media analogous to real respiratory secretions, such as a high concentration of inorganic ions and bicarbonate ions water content.
The findings on aerostability align with previous studies that reported that the virus is primarily spread over a short distance. This might be due to the size of droplets.
The authors further explained that the loss of infectivity after a short distance might be due to the considerable dilution in aerosol concentration, which occurs after exhalation and transport of aerosols beyond the short range.
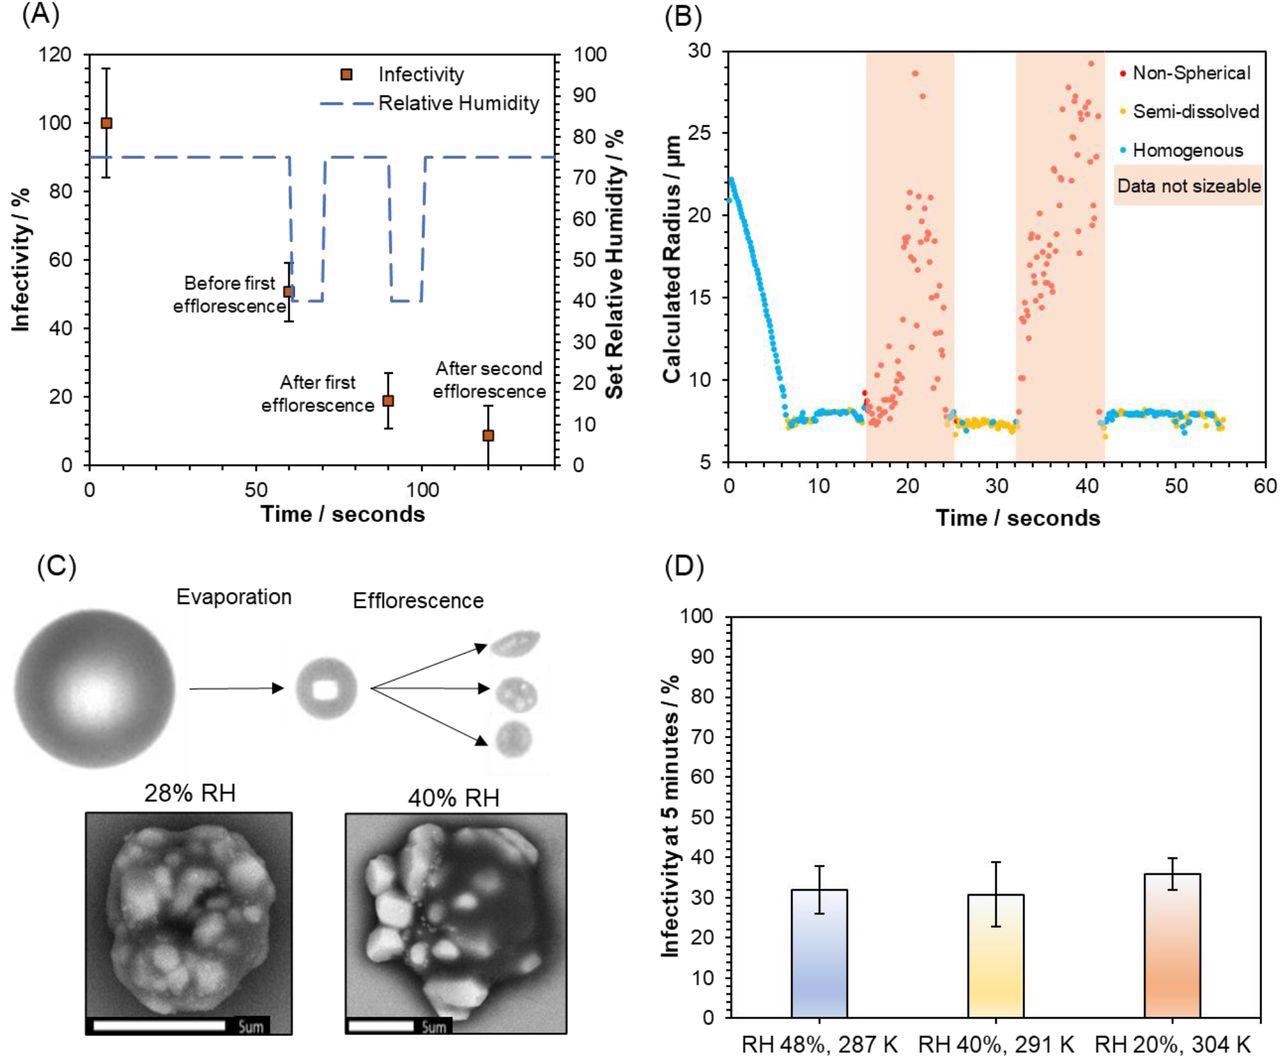
This study reported the most extensive loss of infectivity at the lowest RH. The rapid decrease in SARS-CoV-2 infectivity via droplet crystallization at RH < 45% indicates that dry air may restrict overall exposure.

The Role of Efflorescence in SARS-CoV-2 Airborne Loss of Infectivity. (A) Infectivity curve for SARS-CoV-2 (REMRQ0001) levitated at fluctuating RH. The blue dotted line plotted against the left-hand y-axis shows the changes in the set RH throughout the experiment, whilst the orange data points show the % infectivity (mean of 4 measurements with error bars showing the standard error). Annotations have been added to data points for clarity. (B) CK-EDB measurements show the phase behavior of levitated MEM droplets as the RH is cycled between 75% and 40%, in a similar manner to the survival measurements shown in 4A. RH is initially set at 75%, lowered to 40% at 14 seconds, raised to 75% at 24 seconds, lowered to 40% at 32 seconds, and finally raised to 75% at 41 seconds. Structural information about the droplet is denoted by the color of the data points. Blue when the droplet is homogenous, yellow when solid inclusions are present, red when the particle is no longer spherical (note that size data becomes inaccurate for non-spherical particles, and reported sizes are only included to illustrate this). (C) Images showing the changes in particle morphology that take place whilst MEM 2% FBS is airborne. The top images are from the FDC and show the initial droplet generated by the dispenser on the left, the droplet after 1.6 seconds of evaporation at 28% RH in the center, and three different particles after they have undergone phase change on the right. The bottom shows two SEM images of droplets collected after airborne efflorescence has taken place at 28% RH (left) and 40% RH (right). The scale bar is 5 µm long. (D) % Infectivity of SARS-CoV-2 (REMRQ0001) measured after levitation for 5 minutes at three different temperatures and RHs. Bars show the mean of 5 measurements with error bars showing the standard error.
Future Research
More research is required to confirm further the influence of pH in decreasing SARS-CoV-2 infectivity at high RH—also, the mechanism behind how pH deactivates the virus needs to be studied.
In addition, an elevated concentration of carbon dioxide level indicates poor ventilation, which increases the risk of COVID-19 infection. However, more studies are required to determine the optimal carbon dioxide level that could minimize the risk of viral transmission.
In the future, the authors aim to study aerosol microphysics and biological processes in tandem to understand the underlying parameters that promote SARS-CoV-2 inactivation in the aerosol phase.

 This news article was a review of a preliminary scientific report that had not undergone peer-review at the time of publication. Since its initial publication, the scientific report has now been peer reviewed and accepted for publication in a Scientific Journal. Links to the preliminary and peer-reviewed reports are available in the Sources section at the bottom of this article. View Sources
Journal references:
- Preliminary scientific report.
Oswin, P. H. et al. (2022) The Dynamics of SARS-CoV-2 Infectivity with Changes in Aerosol Microenvironment, medRxiv, 2022.01.08.22268944; doi: https://doi.org/10.1101/2022.01.08.22268944, https://www.medrxiv.org/content/10.1101/2022.01.08.22268944v1
- Peer reviewed and published scientific report.
Oswin, Henry P., Allen E. Haddrell, Mara Otero-Fernandez, Jamie F. S. Mann, Tristan A. Cogan, Thomas G. Hilditch, Jianghan Tian, et al. 2022. “The Dynamics of SARS-CoV-2 Infectivity with Changes in Aerosol Microenvironment.” Proceedings of the National Academy of Sciences 119 (27). https://doi.org/10.1073/pnas.2200109119. https://www.pnas.org/doi/full/10.1073/pnas.2200109119.