Severe acute respiratory syndrome coronavirus 2 (SARS-CoV-2) likely follows a seasonality pattern like other respiratory viral infections. An interplay of the viral pathogen, host, and environmental factors, including seasonal temperature, humidity, and increased indoor activity during the winters, can impact viral stability outside the host.
Moreover, vaccination strategies to date have struggled to keep pace with the emergence of SARS-CoV-2 new variants of concern (VOCs). In the absence of data, public health agencies have no clue about the right time to deploy booster doses that could help maintain peak levels of protection against severe disease throughout the pandemic.
Based on these observations, identifying the seasonal pattern of SARS-CoV-2 infections is crucial for public health planning as well as for determining the optimal timing for booster doses.
About the study
In the present study, researchers retrieved COVID-19 data from the Our World in Data (OWID) database for the US and five EU countries (EU5), including Spain, France, Germany, Italy, and the United Kingdom, from March 2020 to April 2022. They identified anomalies for each country using Twitter’s decomposition method and Generalized Extreme Studentized Deviate (GESD) tests.

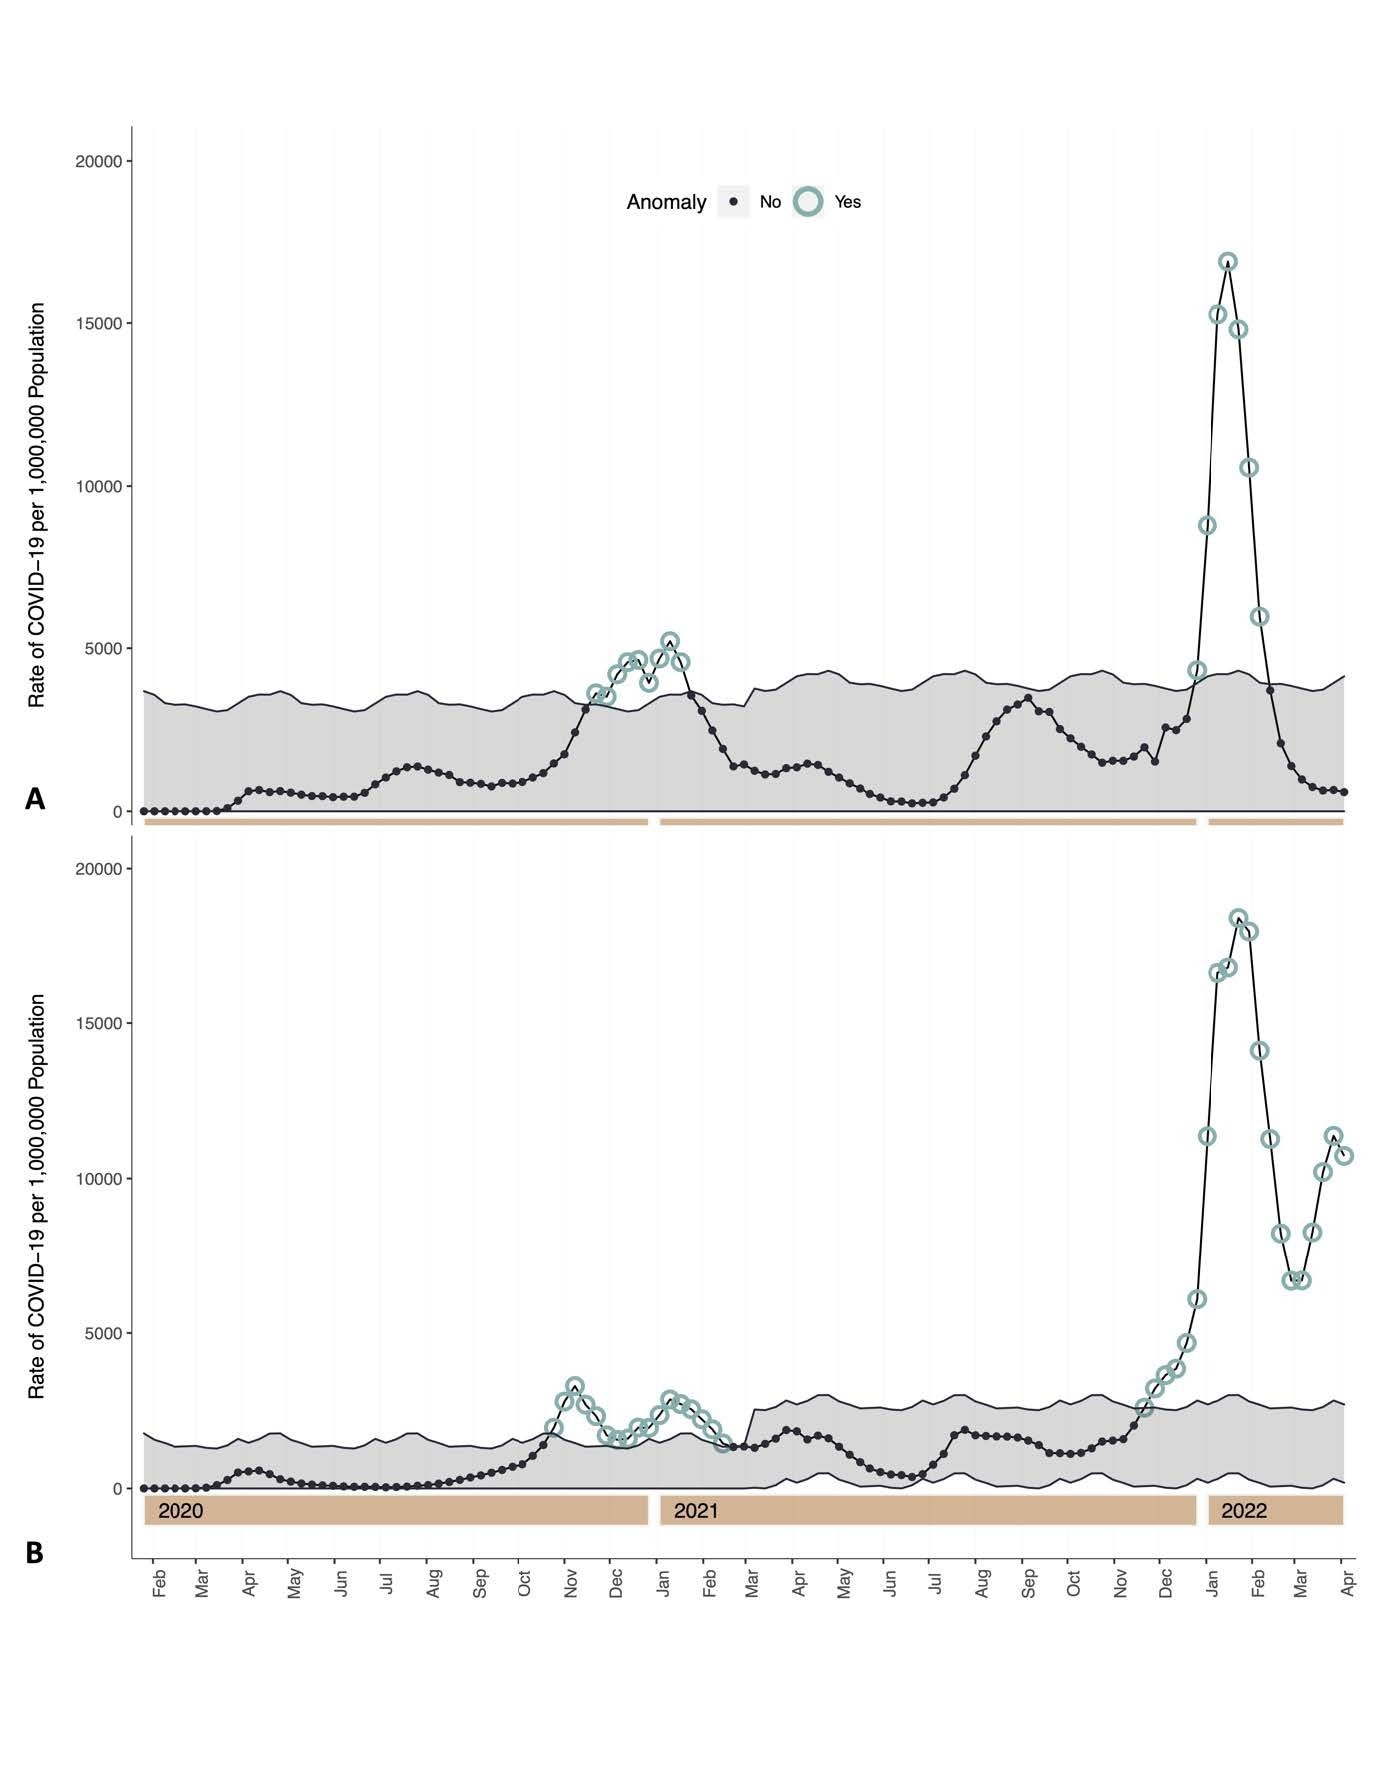
Twitter time series decomposition with generalized extreme studentized deviate (GESD) anomaly detection of COVID-19 rates, Mar 7, 2020 – Apr 9, 2022. Panel A: United States Our World in Data; Panel B: EU5: Italy, Germany, France, Spain, and the United Kingdom, Our World in Data. Shaded areas represent the normal range of data points.

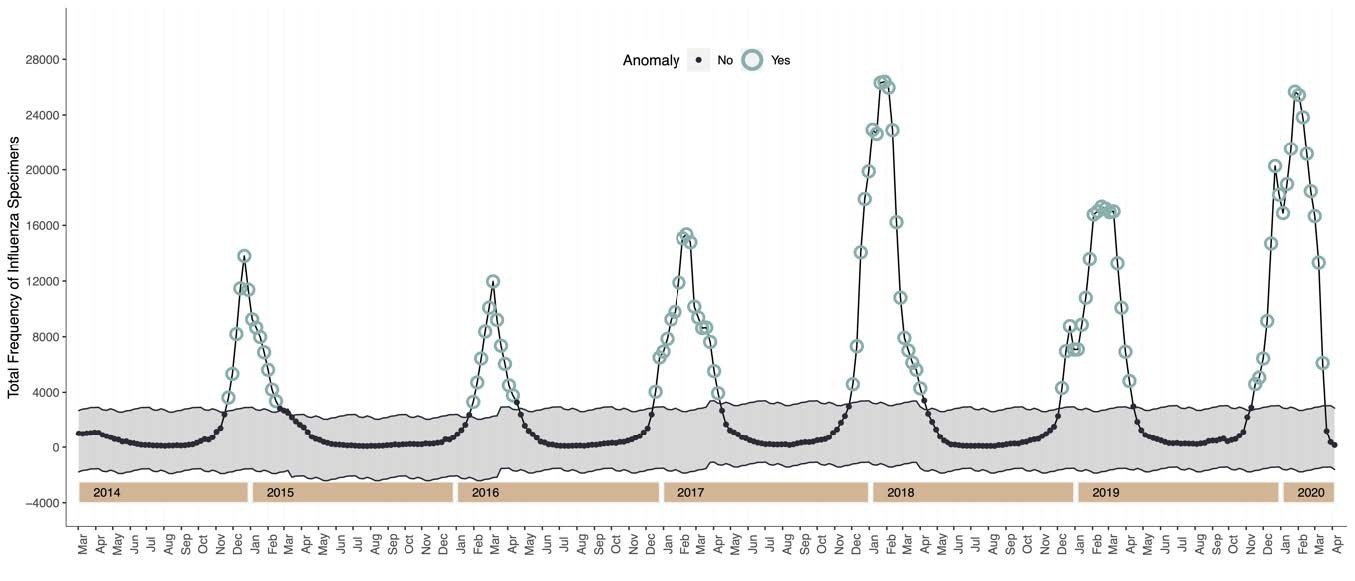
Twitter time series decomposition with generalized extreme studentized deviate (GESD) anomaly detection of Influenza cases, Mar 1, 2014 – Apr 10, 2020. Shaded areas represent the normal range of data points. Data Source: United States Centers for Disease Control and Prevention FluView
Further, the team used Meta’s Prophet approach to decompose US time series rates adjusting for the age-specific proportion of fully vaccinated individuals over time, US holidays, predominant circulating variant, and seasonality. Furthermore, they used Markov chain Monte Carlo simulations to calculate uncertainty intervals for the decomposed components of the Prophet time series.
The researchers performed sensitivity analyses to determine the impact of the data sources. For instance, they compared data from the US Centers for Disease Control and Prevention [CDC] to OWID data. Lastly, they skimmed through seasonal influenza trends using the US Centers for Disease Control and Prevention (CDC) FluView data to determine the accuracy of their time series models.
Study findings
The North, Midwest, and West US Census Bureau Regions had similar seasonal SARS-CoV-2 case spikes between November and February. However, the authors also noted a second seasonal peak in the US Southern region in the late summer of 2021. Anomaly detection analyses reliably predicted seasonal spikes of influenza over six US influenza seasons. Likewise, anomaly plots detected higher than expected COVID-19 rates in the US between November and March each year, which returned to normal by October 2021.
Sensitivity analyses confirmed that the threshold for a proportion of anomalous observations had little impact on seasonal trends. Moreover, the data source did not impact the seasonal US COVID-19 trends. Accordingly, they were similar for both the US CDC and OWID data.
Meta’s Prophet model-based sensitivity analyses also showed an annual seasonal component for US COVID-19 case rates between December and February, with holiday effects near Christmas and New Year’s, Independence Day, and spring break. The same analyses showed remarkably similar trends for influenza but with a little more residual variation.
Conclusions
The study results supported the deployment of protective measures against SARS-CoV-2 in the same time frame as for influenza prevention annually. In the US and EU5, seasonal respiratory viral infection cases spike between December and March every year. Therefore, according to the authors, administering booster shots for COVID-19 before the winter months will most significantly reduce the COVID-19 disease burden.
The study-used methodology was superior to typically used anomaly detection methods to identify seasonal patterns in common respiratory viruses. It showed that the influenza season was longer than the COVID-19 season, possibly due to the additional non-pharmaceutical measures taken for COVID-19, including masking and social distancing. The authors emphasized the need for further confirmatory studies in the Southern Hemisphere and the other US and EU regions to inform public health strategies and stay ahead of forthcoming seasonal COVID-19 waves.
Studies have shown that administering more than one booster dose of COVID-19 vaccines each year is programmatically challenging and can also result in a phenomenon referred to as “booster fatigue.” Thus, timing the administration of an annual COVID-19 vaccine is the most prudent approach to confer vaccine protection at the time of surging COVID-19 cases. Furthermore, it will require careful epidemiological, benefit-risk, and programmatic considerations to give additional booster shots to some high-risk groups moving forward. So while vaccination alone is unlikely to lead to the elimination of SARS-CoV-2, deploying vaccines on schedule can still mitigate future waves of SARS-CoV-2 infection.

 This news article was a review of a preliminary scientific report that had not undergone peer-review at the time of publication. Since its initial publication, the scientific report has now been peer reviewed and accepted for publication in a Scientific Journal. Links to the preliminary and peer-reviewed reports are available in the Sources section at the bottom of this article. View Sources
Journal references:
- Preliminary scientific report.
Is COVID-19 seasonal? A time-series modeling approach, Timothy Lee Wiemken, Farid Khan, Jennifer L Nguyen, Luis Jodar, John M McLaughlin, medRxiv pre-print 2022, DOI: https://doi.org/10.1101/2022.06.17.22276570, https://www.medrxiv.org/content/10.1101/2022.06.17.22276570v1
- Peer reviewed and published scientific report.
Wiemken, Timothy L., Farid Khan, Laura Puzniak, Wan Yang, Jacob Simmering, Philip Polgreen, Jennifer L. Nguyen, Luis Jodar, and John M. McLaughlin. 2023. “Seasonal Trends in COVID-19 Cases, Hospitalizations, and Mortality in the United States and Europe.” Scientific Reports 13 (1). https://doi.org/10.1038/s41598-023-31057-1. https://www.nature.com/articles/s41598-023-31057-1.