An interview with Fred Kielhorn, CEO of DeNovix, conducted by Jake Wilkinson, MChem
What impact has the ability to measure microliter volumes of samples via US-Vis spectrophotometry had on life sciences research?
Prior to microvolume spectrophotometry, UV-Vis quantification of biomolecules was performed using quartz cuvettes with a 10mm pathlength. Cuvettes had a number of key limitations that made them unsuitable for the requirements of then newly emerging life science techniques such as microarrays.
Cuvettes required large volumes of sample, required cleaning between each sample and had a limited concentration range over which they could accurately quantify.
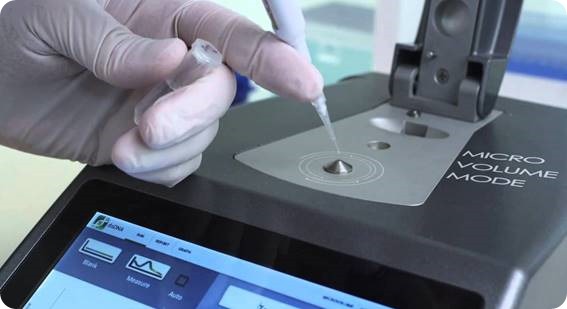
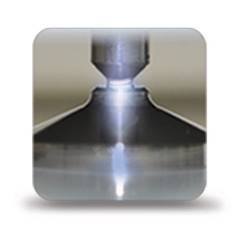
The development of microvolume spectrophotometry eliminated the cuvette from UV-Vis quantification by using a drop of sample to bridge a gap between two measurement surfaces.

Image credit: DeNovix
Light passes directly through the sample and the pathlength set by the distance between the surfaces, rather than the dimensions of a cuvette.
Eliminating cuvettes had some crucial advantages in the life sciences. First, it enabled scientists to quantify very small volumes of sample, typically one microliter. Genomics then, as now, was moving towards smaller volumes and lower concentrations as the complexity of samples was reduced.
Prior to microvolume analysis, samples were diluted into large buffer volumes and measured using cuvettes. Microvolume methods removed the requirement for dilution by directly assaying the sample.
Using extremely short pathlengths, microvolume spectrophotometers can measure across a wide dynamic range. This improved the accuracy of measurements and saves time and precious sample.
Has the technique allowed new experiments, that were not previously possible, to be undertaken?
Microvolume quantification has become a critical part of the workflow for many cutting edge techniques in life science research.
Applications such as Next-Gen sequencing and microarray rely on accurate quantification of samples prior to and during the assay as a key aspect of quality control and whether to progress to the next stage of the workflow.
 Protein applications were initially slower to embrace this technology. The first instruments on the market stretched a sample column between sample pedestals and the lower surface tension of protein buffers occasionally led to broken columns and inaccurate results.
This led to skepticism towards the suitability of microvolume UV-Vis for protein measurements. This is overcome in the DeNovix DS-11 Series as the sample is compressed to the optimum pathlength and never stretched.
This has led to many protein and antibody labs adopting the technology for the first time and enabled applications such as rapid quantification of high concentration, therapeutic protein formulations.
Image credit: DeNovix
What is best practice for preparing and delivering a spectrophotometric sample?
One of the advantages of DeNovix microvolume spectrophotometry is that the instrumentation and software are simple and quick to use, but there are some important aspects of best practice that should considered.
- Ensure that sample preparation methods are optimized and that samples are purified prior to measurement. All nucleic acids exhibit a peak absorbance at or around 260nm.
The presence of fragmented DNA, oligos or RNA in genomic DNA sample for example will contribute to the total absorbance at 260nm and lead to an overestimation of the sample concentration.
- Avoid buffers that absorb strongly at the same wavelength as your sample. If contaminants are present and unavoidable, instruments such as the DeNovix DS-11 FX also allow fluorometric methods to be used that will specifically quantify the molecule of interest. Combing fluorometric and absorbance methods gives a complete quantitative and qualitative picture of a sample.
- Ensuring that both the top and bottom measurement surfaces are clean prior to loading blanks or samples is important to deliver accurate results. Performing a blank on a dirty measurement surface can lead to anomalous results, for example negative spectra.
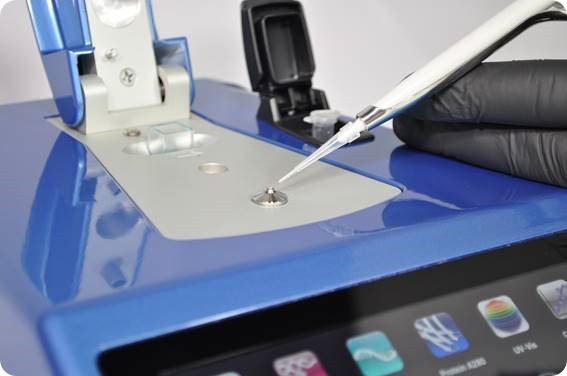
- Sample delivery is simple in microvolume spectrophotometry but there are some best practices that can be applied to ensure high quality results. Aliquoting small volumes from non-homogenous samples can be a source of data variability so, prior to loading, samples should be thoroughly defrosted and vortexed to ensure they are well mixed.
Samples should then be loaded with an appropriate sized pipette, and a fresh tip for each aliquot. If replicates are being tested, a fresh aliquot should be used for each measurement.
DS 11 Series | Spectrophotometer | Fluorometer
Can any buffer be used for spectrophotometric measurements or are specialized buffers required?
There is no requirement for specialized buffers for using microvolume spectrophotometry but buffers with strong absorbance at the wavelength of interest should be avoided. It is also advisable to avoid highly volatile buffers.
What other parameters are important, and how can they be controlled, to ensure accurate results?
In order to gain quantitative results from absorbance measurements, the Beer-Lambert equation is used. This correlates the absorbance with the concentration of the sample, its molar absorption coefficient and the distance which light passes through the sample – the pathlength.
A=ε*b*c
- A: absorbance value
- ε: absorptivity coefficient with units of L /mol * cm
- b: pathlength of the sample expressed in terms of cm.
- c: concentration of the sample in solution, expressed in mol/L.
The accuracy of quantification is therefore intrinsically linked to the accuracy with which the pathlength can be set. In cuvette-based systems this distance is set by the dimensions of the cuvette and is typically 10mm.
Microvolume systems employ various methods to set this distance. Often, set-screws are used to set one or two pathlengths that either the user or the software switches between.
At DeNovix, our measurement system includes SmartPath® Technology. SmartPath allows us to precisely control the distance between the two measurement surfaces to within one micron and use real-time absorbance feedback to deliver the optimum pathlength for each sample.
How does DeNovix’s SmartPath Technology ensure that the pathlength is correct?
The DS-11 uses a patented opto-mechanical system with proprietary algorithms that together control the pathlength. SmartPath uses a precision optical adjustment screw along with a high-resolution encoder that delivers precise and reliable pathlength control.
DeNovix DS-11 | Spectrophotometer | UV-Vis Spectrophotometry
The rotation to pathlength relationship is well characterized and unchanging, allowing the pathlength to be set with total confidence without the need for recalibration or routine maintenance.
The DS-11 uses real-time absorbance data to determine the optimal pathlength for each sample, automatically shortening the distance between the measurement surfaces to deliver accurate results.
Higher concentration samples require increasingly shorter pathlengths and the fine control that DeNovix has over the optical path enables us to accurately set extremely small pathlengths reliably and reproducibly without the requirement for calibration.
Do microvolume spectrophotometers require routine calibration checks?
Poorly calibrated pathlength is a potential systematic error for some microvolume systems. Deviation in pathlength from the calibrated value will cause a consistent error in every sample measured.
Many instruments in this market require the user or a service engineer to validate the calibration at regular intervals. If the instrument fails a calibration check the user incurs the cost of a service engineer to recalibrate, faces instrument downtime, and the data collected between calibrations can be called into question.
SmartPath Technology provides the user with confidence that each pathlength is accurately determined, every time. The DS-11 Series does not require any routine maintenance or calibration checks which decreases the on-going cost of ownership and provides confidence that accurate and reproducible results will always be obtained.
What spectrophotometers do DeNovix provide for microliter measurements?
The DS-11 series of Spectrophotometers / Fluorometers combine three measurement modes. Microvolume UV-Vis is present throughout the range and the customer can select from models that integrate this with cuvette-based UV-Vis and/or fluorescence.
Demo on Demand | Spectrophotometer | Fluorometer
Each mode has an optimized light source and optical path specific for the application ensuring no compromise in performance.

Image credit: DeNovix
For those only requiring fluorescence, our QFX fluorometer incorporates all of the software and networking capabilities of the DS-11 range but without absorbance.
What features of the DS-11 Spectrophotometer make it ideal for performing microliter measurements?
The key feature customers always tell us that determines their decision to buy the DS-11 is the accuracy and precision with which it delivers data. The DS-11 is the most sensitive microvolume spectrophotometer and measures the broadest concentration range. It is also the only instrument to combine true microvolume absorbance and fluorescence.
All of our instruments have a large, glove-compatible touchscreen and run our unique EasyApps® software, designed and developed in-house at DeNovix. The DS-11 fits seamlessly into either Wi-Fi or wired networks and allows exporting of data via email, network drives, network printers, label printers, LIMS systems or to USB drives.
Where can our readers find out more about performing more accurate microliter spectrometers?
Technical notes and white papers are available at www.denovix.com. DeNovix also runs a free in-lab trial program and a trade-in program.
About Fred Kielhorn
 Mr. Kielhorn started his career in 1988 with DuPont and held positions in catalysis R&D, process development, logistics and market development over a 15 year period. In 2000, he had the opportunity to co-found NanoDrop Technologies Inc. along with Charles Robertson, Patricia Robertson and Lynne Kielhorn.
During his time as President of NanoDrop, the company developed and launched three successful products for life science research. In 2007, NanoDrop was acquired by Thermo Fisher Scientific and he then formed the venture capital firm, Kielvest LLC.
Over several years, Kielvest made many investments into early-stage technology. In 2012, Kielhorn founded DeNovix Inc. and is the company’s CEO. Fred holds a BS in Chemical Engineering from University of Missouri-Rolla (now known as Missouri University of Science and Technology).