The genetics of facial features
GWAS of human facial characteristics has been used to explain the genetic causes of different facial features among people. Genomic regions equipped with regulatory elements that are active during craniofacial development have been identified, many of which overlap with developmental genes.
These findings have been published mainly in studies conducted on people of European origin. More recently, GWASs that focus on facial features have included non-European populations. Non-European characterization is aiding in the comprehensive understanding of the variable genetic composition and evolution of facial characteristics in humans.

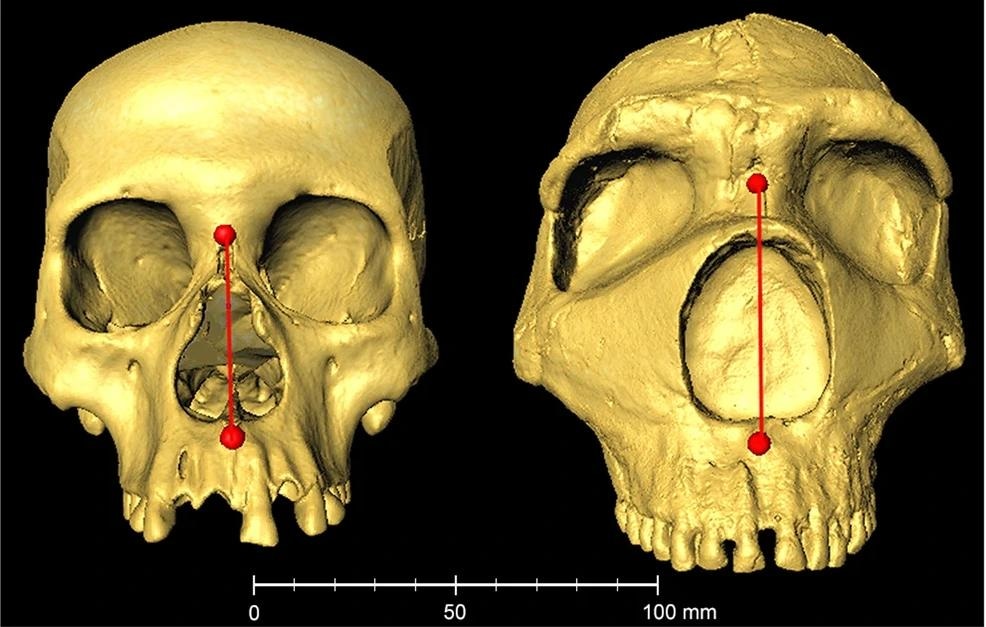
Example skulls from a modern human (Native American) and a Neanderthal (Amud 1). The 3D images are reproduced on the scale shown underneath. Nasal height (distance between the nasion and sub-spinale landmarks) is shown as a red line (modern human = 50.2 mm; Neanderthal = 63.8 mm). The modern human image is from the collection of the División de Antropología, Museo de La Plata (Argentina). The Neanderthal image was obtained from the MorphoSource repository (https://www.morphosource.org/concern/media/000005749).
About the study
In the present study, researchers perform GWAS on over 6,000 samples obtained from Latin Americans to analyze facial features and their relationship with inter-landmark distances.
The Consortium for the Analysis of the Diversity and Evolution of Latin America (CANDELA) cohort included samples from 6,486 individuals in five Latin American countries. GWAS involved genotyping and characterizing individuals for a standard group of covariates.
The Face++ cloud service platform was used to automatically position 106 landmarks placed on frontal two-dimensional (2D) photographs. The researchers also computed Interclass Correlation Coefficients (ICCs) and median Euclidean distances among manually placed landmarks, Face++, and Dlib. Face++ accurately placed landmarks and outperformed Dlib for some landmarks, as indicated by both metrics.
Inter-landmark distances (ILDs) were measured by determining the distances between 34 Face++ landmarks. The correlation between ILDs and a maximum of 11,532,785 single nucleotide polymorphisms (SNPs) on 5,988 individuals was also determined after implementing quality control (QC) filters for phenotype and genotype data.
Data from East Asians, Europeans, and Africans were also analyzed. The researchers also screened a window around the association signal in 1q32.3 to assess the connection and evidence of introgression between the association signal and Neanderthal introgression in the area using CANDELA data.
Results
A total of 301 distances were obtained after considering face symmetry. The obtained distances exhibit significant variation and follow a roughly normal distribution. Furthermore, the correlation between various distances and three head angles, including pitch, yaw, and roll angles estimated by Face++ is significant, thus indicating the impact of head pose.
A correlation was also observed between ILDs and covariates ranging from low to moderate. The distances between landmarks 6-4, 6-2, and 8-12 showed the strongest association with sex. Women had greater distances than men in three areas related to eyebrow shape.
The distance between landmarks 4-21, which is related to the spacing between the eyebrow and eye, as well as estimates of lip thickness, had the strongest relationship with age. Among Europeans, the strongest association was observed for facial distances related to the nasion position, thickness of the lips, breadth of the nasal root, and breadth of the nose wing.
A total of 42 genomic regions were significantly linked to a minimum of one ILD, with 148 distances associated with these 42 areas. Notably, only nine of these genomic regions have been previously reported, whereas 16 were present on a chromosome band that has not previously been linked to facial features.
A novel replicating region was identified in 1q32.3. The region contained SNPs linked to ILDs D166, D203, and D233, which affect landmark 13, along with landmarks 19, 23, and 25, respectively. The most significant correlation was found between ILD D203 and rs12564392.
The strongest relationship noted in the GWAS coincided with the peak of Neanderthal introgression in 1q32.3. Neanderthal tracts were present in up to 31% of CANDELA chromosomes in this area. The Neanderthal tracts had a significant association with distances D166, D203, and D223, which led to an increase in these distances that reflects the markedly greater nasal height often observed in Neanderthals.
Conclusions
Several genome regions appear to be associated with facial features through GWAS. Some regions overlap with genes that have been experimentally proven to be involved in craniofacial development.
Notably, most of the SNPs linked to facial features are located in non-coding regions. These SNPs are primarily found in regulatory elements of the genome that are active during craniofacial development. The identified novel loci and their associated SNPs exhibit similar characteristics to those found in prior GWAS of facial morphology.
Future studies can similarly apply the automated landmarking approach utilized in the current study to analyze a greater number of more diverse samples. This research would allow scientists to gain a better understanding of the genetics responsible for facial variations observed in the global human population.
Journal reference:
- Li, Q., Chen, J., Faux, P., et al. (2023). Automatic landmarking identifies new loci associated with face morphology and implicates Neanderthal introgression in human nasal shape. Communications Biology 6(1); 1-13. doi:10.1038/s42003-023-04838-7