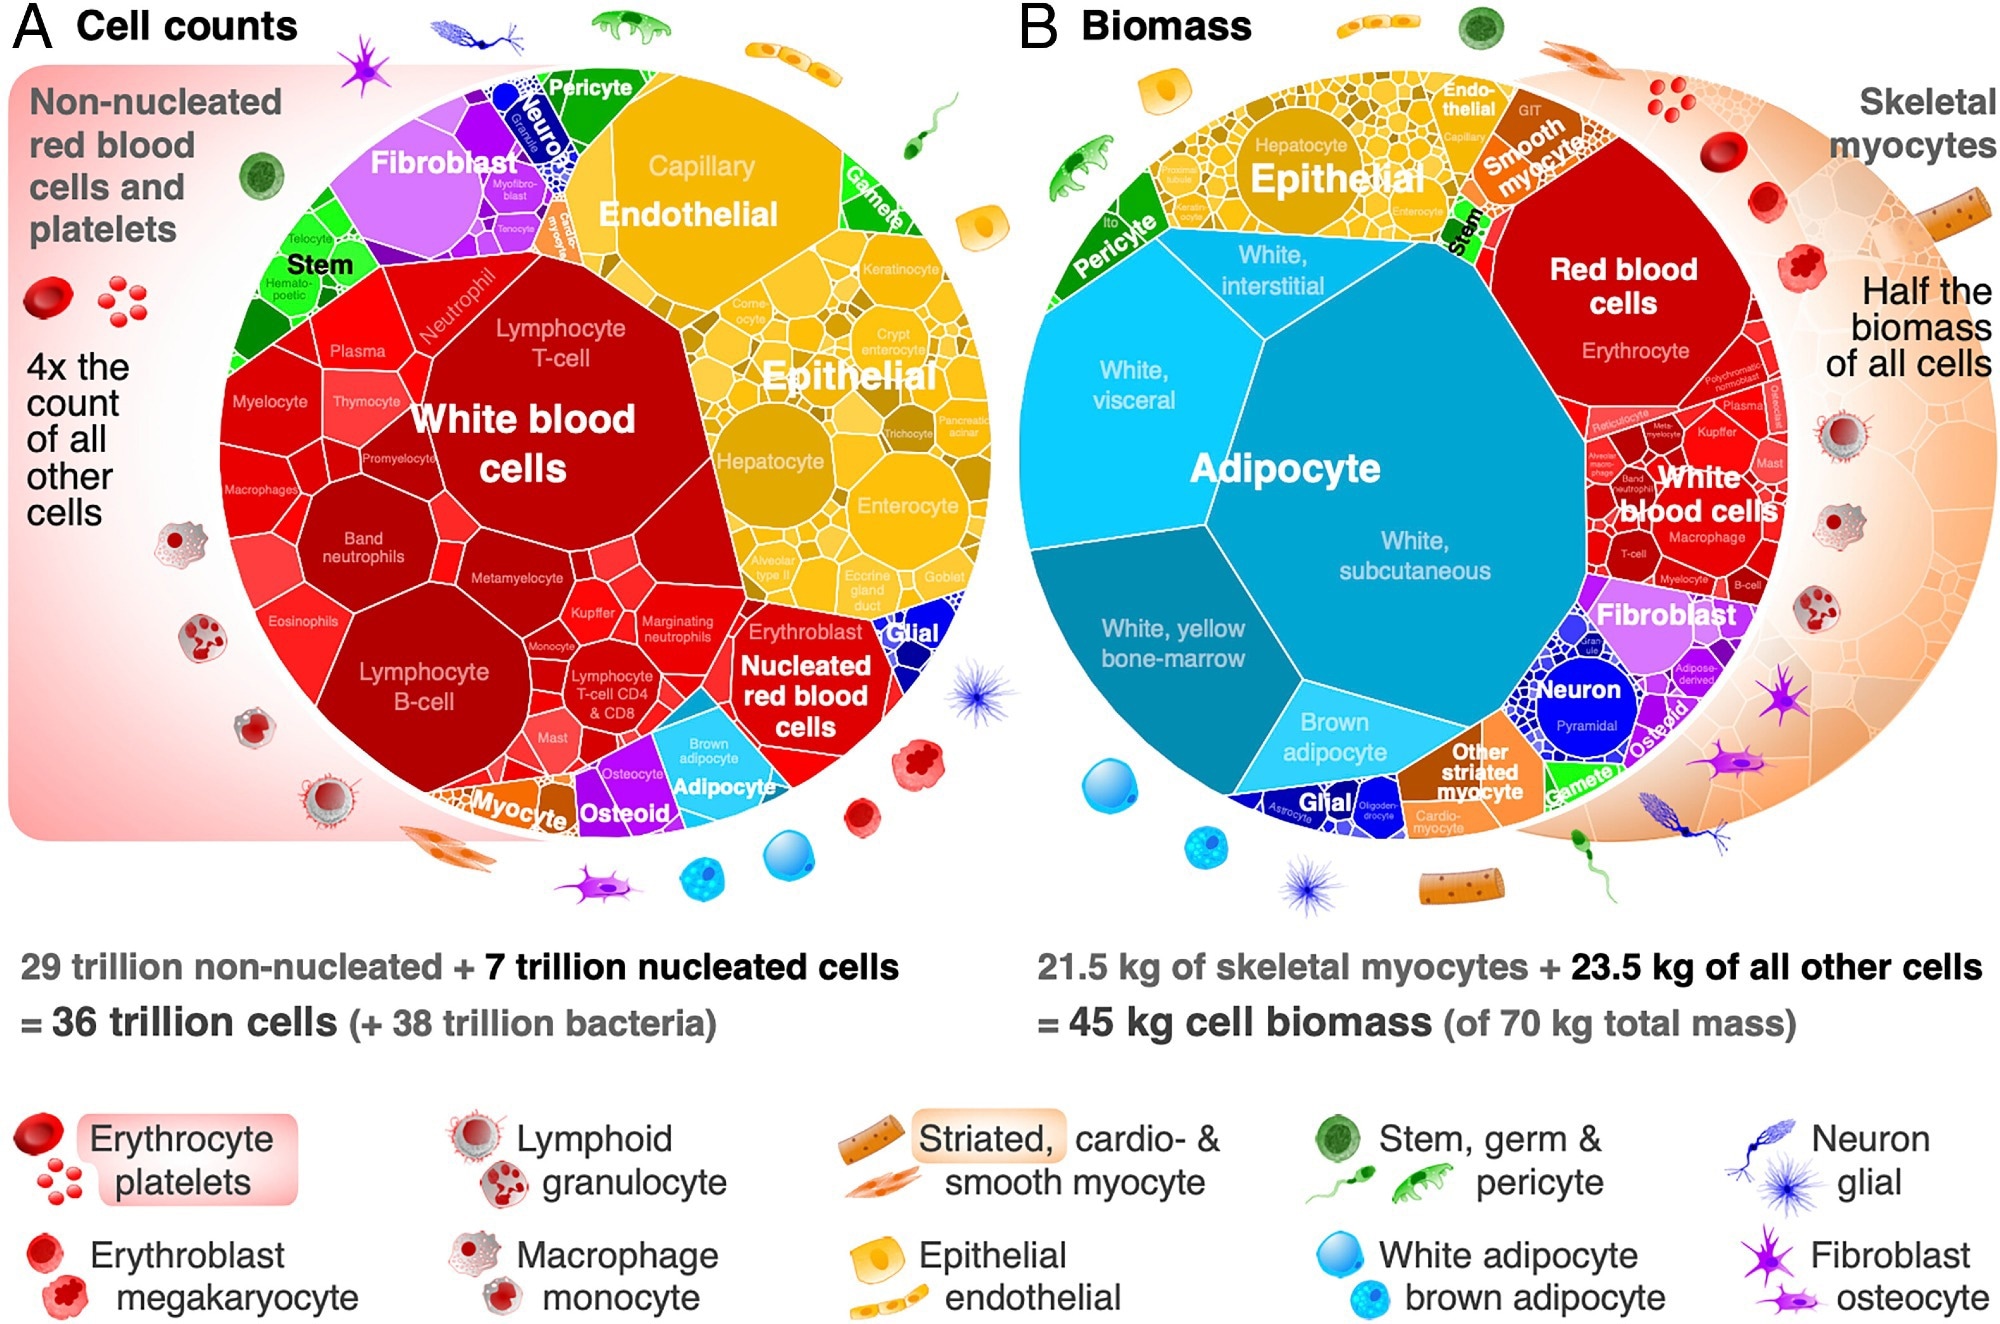
Cells, the foundational units of life, maintain specific sizes consistent across mammals, with larger bodies having more cells than larger ones. This consistent cell size facilitates their designated functions; deviations often indicate diseases. Cell types, like neurons and myocytes, possess size specificity essential for their tasks. Although past research hints at around 30 to 37 trillion human cells, a comprehensive understanding of the relationship between cell size and count remains unexplored. As endeavors like the Human Cell Atlas emerge, aiming to profile every human cell type, our data, integrating histology and anatomy, could provide a quantitative baseline for understanding cellular composition and function. This consolidated view aids in bridging modern single-cell research with classical cell biology, emphasizing the need for continued research into body-wide cell metrics.
About the study
The present study compiled data on cell sizes across the human body using three anatomical models: male, female, and child. Drawing from over 1,500 sources, the researchers identified around 400 unique cell types spread over 60 tissue systems. Using the male model as a reference, which had more detailed data, they made estimates for females and children based on certain assumptions.
 Contrasting cell count and biomass distributions by cell type. Voronoi tree maps for all 400 investigated cell types of the reference male anatomical model (area represents relative cell number or biomass). (A) Cell counts are dominated by red blood cells and platelets, which are removed from the cell count tree map. Even after removing nonnucleated blood cells (≈29 trillion), white blood cells (≈3.4 trillion) still dominate the ≈7 trillion nucleated cell count, with 98% of white blood cells as tissue resident, 1% circulating and 1% intravascular marginating. (B) Cell biomass is dominated by skeletal myocytes, comprising about half of all 45 kg of cell biomass in the body, even though they make up <0.002% of the nucleated cell count, which are removed from the biomass tree map. Most of the remaining 23.5 kg of cell biomass are white adipocytes (≈12 kg; though body fat varies widely among subjects). Tree maps for a reference 60-kg female (≈28 trillion cells) and 32-kg child (≈17 trillion cells), and more detailed cell groups and organ systems can be explored at https://humancelltreemap.mis.mpg.de/ (SI Appendix, Figs. S7–S9).
The study adjusted cell sizes for myocytes and nerve cells based on system growth or shrinkage, though counts remained consistent across genders and ages. The male model revealed that blood cells weigh about 4.7 kg, divided into 53 types spanning 30 tissue systems. Data from the International Commission on Radiological Protection (ICRP), including tissue masses and fat and protein contents, was gleaned from autopsies and imaging. The male brain was found to contain approximately 88 billion neurons and a similar number of non-neurons.
Estimation challenges arose, especially with epithelial and endothelial cells, due to their broad distribution. Detailed information on fibroblasts and osteoid cells across tissues was also noted. Males have 13.3 kg of adipocyte cellular mass spread across areas like hypodermal and visceral regions, with distinct values in females and children. The study extensively mapped cell size distributions in the human body.
Study results
The comprehensive dataset assembled provides an in-depth view of the parameters for all major human cell types, delivering unparalleled detail across various tissue systems. For instance, it meticulously details muscle fiber sizes of all major skeletal muscle groups, neurons, and glial cell groups within the peripheral and central nervous systems, and blood cell groups from their creation in the bone marrow to their eventual distribution in major blood organs and tissues. Moreover, specific emphasis was directed towards tissues vital for human health, including the digestive system and female reproductive tissues.
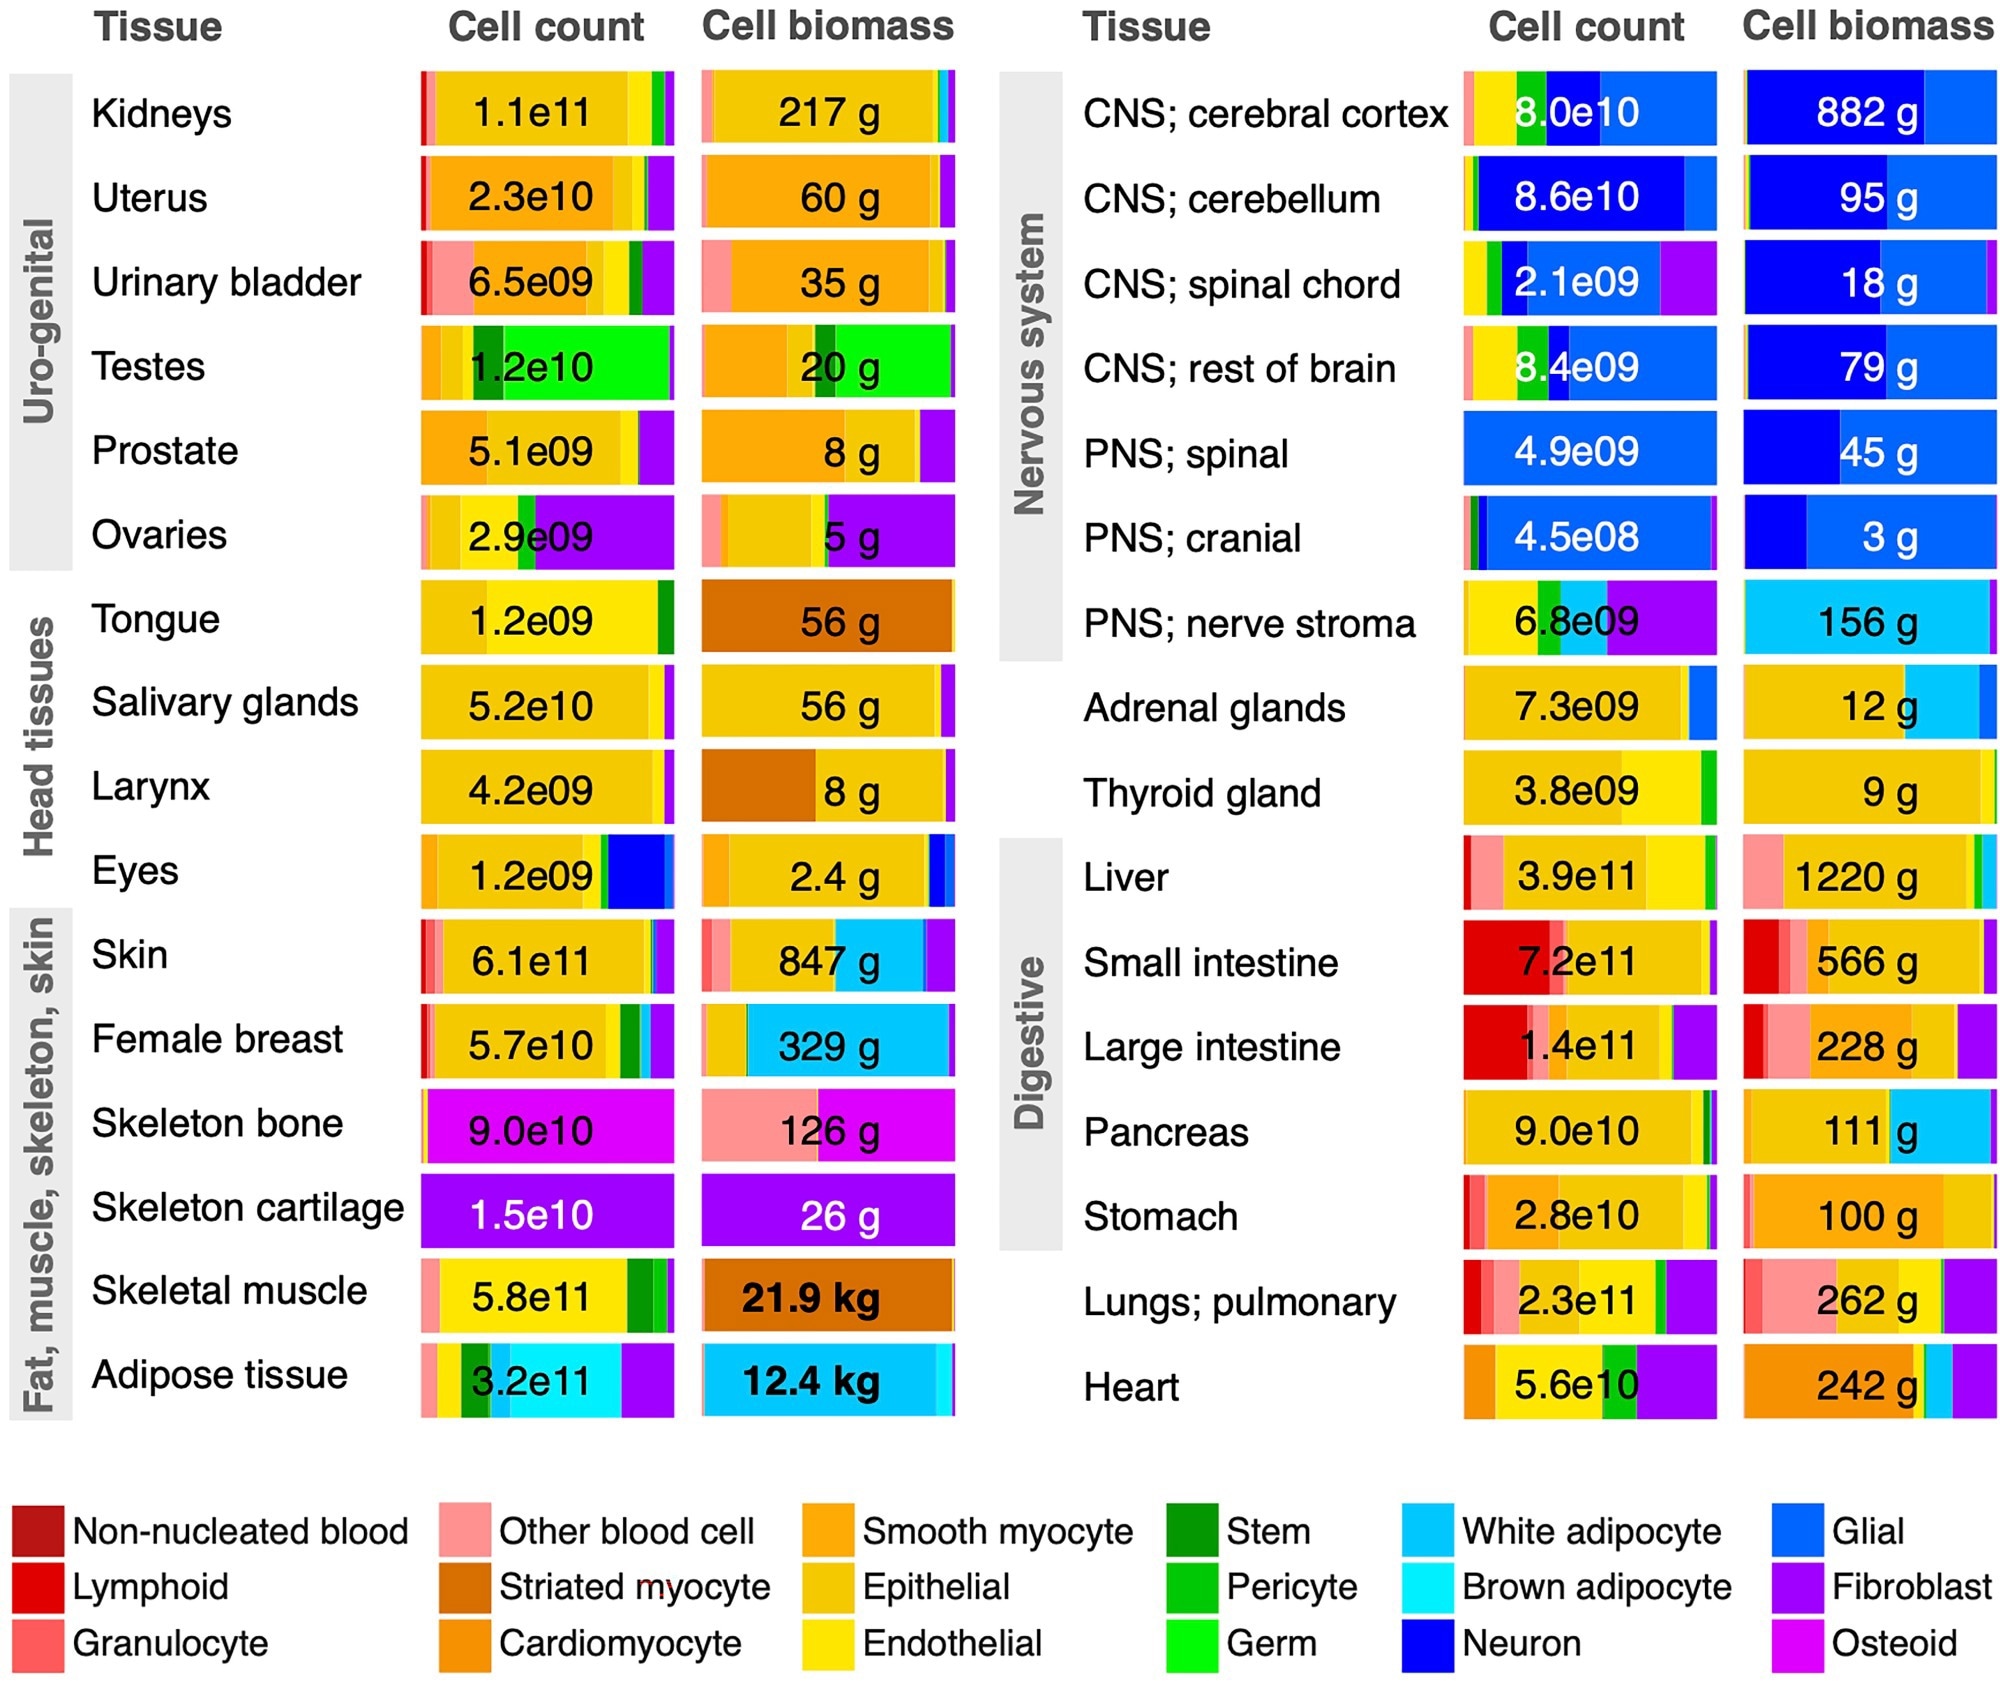
 Cell class distributions across select tissues. Cell count and biomass distributions across 18 broad cell classes (colored) are shown for the 32 most significant tissue systems of the body, representing about half of all 60 investigated tissue systems, including the vast majority of total cell biomass. Numerical values refer to a reference male except for the female breasts, uterus, and ovaries. Most tissue systems are dominated by the ≈140 distinct cell types making up the epithelial cell class. “CNS” and “PNS” refer to central and peripheral nervous systems, respectively. The “Other blood cell” class is dominated by macrophages, but includes monocytes and precursors to red blood cells and platelets. Cell biomass excludes noncellular components of biomass in each tissue, made up of extracellular water, protein, and minerals
The present research underscores the vastness of the size spectrum of human cells, with a red blood cell being over a million times smaller than a myocyte. Certain distinct patterns emerged when examining the distributions between cell count and biomass. Cell counts chiefly comprise platelets, red blood cells, and tissue-resident white blood cells. In contrast, cell biomass predominantly comprises muscle and fat cells.
A broader perspective of cell size and count is constructed through a cell-size histogram that spans the human body. Assuming a lognormal distribution—deemed fitting for most cell types—the researchers adopted this to better relate each of the 1,264 cell groups in their dataset. The relationship found between the log total count in each log size class aligned from the diminutive red blood cells to the significantly larger myocytes. This relationship hints at an almost inverse connection between cell size and count, suggesting that when a cell's size increases by a certain factor, its count decreases by a similar factor, and vice versa.
Interestingly, the cellular biomass is generally uniformly spread among cell-size classes, but it is not without its irregularities. Among the smaller cells, the size distribution sees interruptions around platelets and haploid sperm cells. Distinctly larger cells, like adipocytes and myocytes, display broad size distributions, with their counts staying relatively static irrespective of factors like obesity or muscle degradation.
Furthermore, the data provides a lens into the variation in cell size across different cell types. With adequate data for numerous cell groups, the variation in size for these groups was calculated. The results showed that, across a broad range of cell sizes, the coefficient of variation (CV) remains relatively consistent. This consistency in CV could indicate that mechanisms governing cell size remain uniform across various cells in the human body.
Conclusions
To summarize, the study recognized variations could arise from biological differences or measurement inaccuracies, revealing uncertainties in various cell types; while the relationship between cell ploidy and cell mass remains unexplored, initial estimates indicate only a small percentage of all nucleated cells are polyploid. There is a noticeable pattern where cell size and count are inversely related, seen across various organisms. The origins of these patterns are not universally acknowledged, but many factors could influence them, including cell growth and division rates. Lastly, this data could have various applications, from understanding immune functions, refining lymphocyte count estimates, aiding in cell identification techniques to acting as a reference for future studies, possibly offering insights into energetic predictions based on cell size.