Turbidimetry (also known as turbidimetric immunoassay) is an approach frequently commonly used for the diagnosis of clinical immunological reagents.
In recent years, one of the emergent homogeneous turbidimetries is PETIA (Particle-enhanced turbidimetric immunoassay), which offers more stable and accurate access to quantifying the level of antigen-antibody complexes in body fluids.
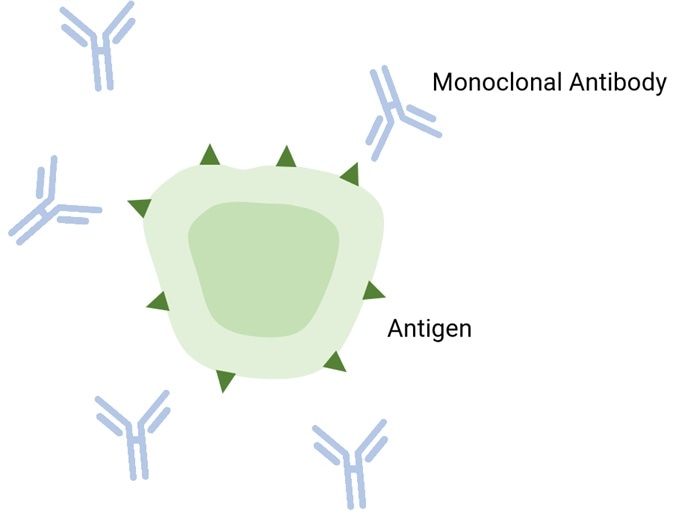
Image Credit: Bettersize Instruments Ltd.
It works by identifying the opaqueness of the diagnostic reagent that contains immunoparticles mixed with a specimen that could potentially also contain the target analyte (antigen). Polystyrene latex nanoparticles coated with monoclonal antibodies are frequently used as antigen-antibody complexes in PETIA.
The concentration, size, and size distribution of latex particles are key indicators for the development of immunodiagnostic reagents since they affect the responsiveness and sensitivity of PETIA tests significantly as well as impacting the stability of the reagents.
In this article, characterization of the particle size and size distribution of three latex samples coated with monoclonal antibodies in the R&D stage was conducted.
Experimental
Equipped with a laser with a wavelength of 671 nm and a power of 50 mW as the light source, the BeNano 90 nanoparticle analyzer from Bettersize Instruments Ltd. was used with an APD detector set at an angle of 90° to collect scattered light signals.
Three latex complexes were measured, and the relative information collected is displayed below:
The measurements were conducted at 25 °C with the built-in temperature control unit in the BeNano 90. Each sample was subjected to measuring at least three times over to obtain the standard deviations of sizes and evaluate the result repeatability.
Table 1. Sample information. Source: Bettersize Instruments Ltd.
| Sample |
Dilution Times |
Dispersant |
| A |
1000 |
Distilled Water |
| B |
1000 |
Distilled Water |
| C |
2000 |
Distilled Water |
Results and discussion
Through an analysis of the original scattered light signals, the correlation functions of samples are acquired as displayed below.
Figures 1 - 3 demonstrate the correlation functions of three samples. As depicted, the correlation functions suggest high repeatability, which highlights the outstanding stability of the BeNano 90’s optical system.
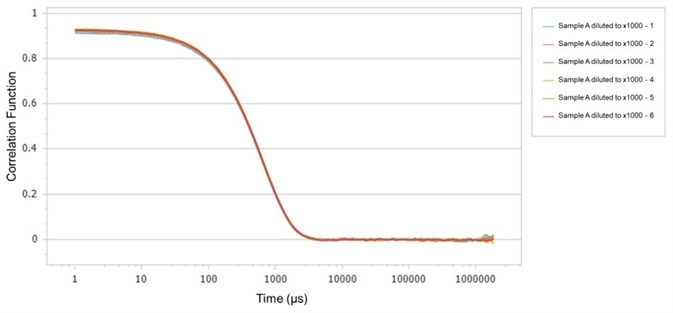
Figure 1. Correlation functions of Sample A. Image Credit: Bettersize Instruments Ltd.
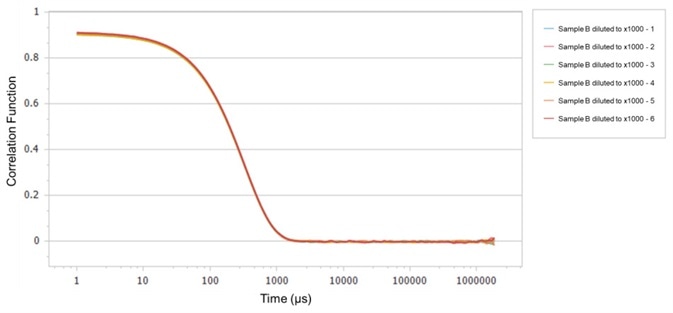
Figure 2. Correlation functions of Sample B. Image Credit: Bettersize Instruments Ltd.
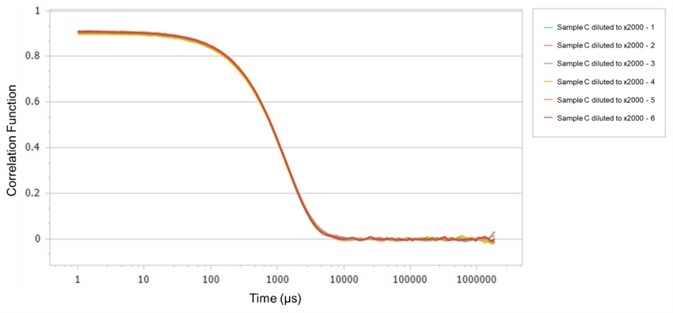
Figure 3. Correlation functions of Sample C. Image Credit: Bettersize Instruments Ltd.
Figures 4 - 6 exhibit the particle size distributions (PSD) of three samples. The PSD of each sample reaches excellent repeatability under such test conditions.
By way of comparison of the PSDs of the three samples shown in Figure 7, it can be deduced that the size of Sample C > Sample A > Sample B and their PSDs are greatly differentiated.
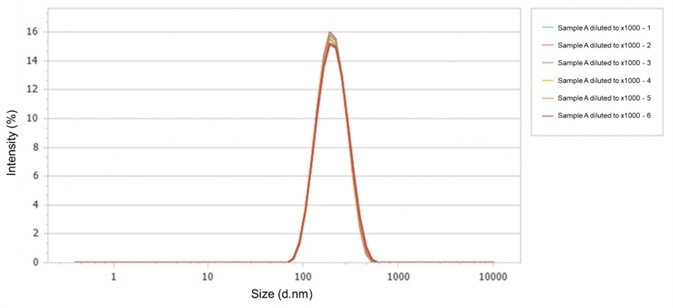
Figure 4. Particle size distributions of Sample A. Image Credit: Bettersize Instruments Ltd.
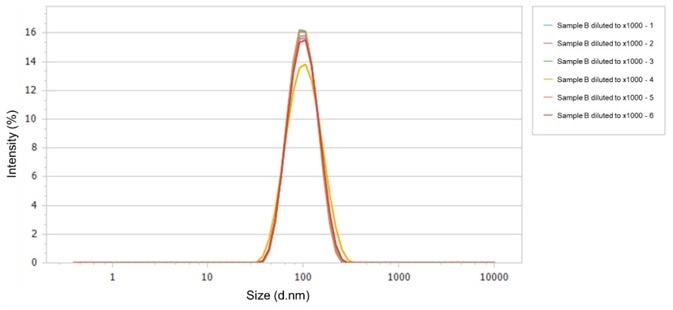
Figure 5. Particle size distributions of Sample B. Image Credit: Bettersize Instruments Ltd.
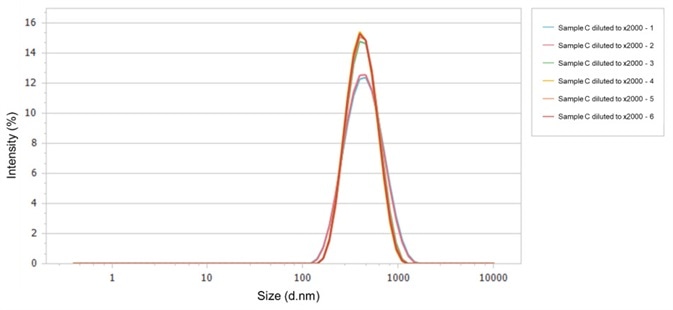
Figure 6. Particle size distributions of Sample C. Image Credit: Bettersize Instruments Ltd.
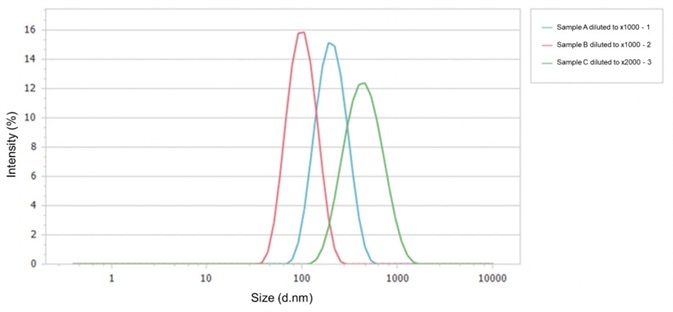
Figure 7. Particle size distributions of Sample A, B, and C. Image Credit: Bettersize Instruments Ltd.
The measurement results in Table 2 indicate that the Z-average sizes of the three samples differ considerably. Sample C is the largest in size, followed by Sample A, and Sample B is the smallest.
The size difference between sample B and sample C is approximately four times. The relative standard deviation (RSD) of the repeatability of each sample is lower than 1%.
The polydispersity index (PDI) of all samples is lower than 0.05, indicating that there is a narrow distribution of all particle size samples are narrow, and they are also monodisperse in size.
Table 2. Measurement results of Sample A, B, and C. Source: Bettersize Instruments Ltd.
| Sample |
Z-average size (nm) |
RSD% |
PDI |
| A |
200.47 ± 1.73 |
0.86 |
0.027 |
| B |
99.52 ± 0.41 |
0.42 |
0.028 |
| B |
411.59 ± 4.05 |
0.98 |
0.029 |
Conclusions
The BeNano 90 has the capacity to offer extremely accurate and reproducible test results in the field of immunodiagnostic assays, making it a powerful process-monitoring tool for the production and development of such latex-antibody immunological reagents.
About Bettersize Instruments Ltd.

With over 25 years experience developing and manufacturing particle characterization instruments, Bettersize has introduced breakthrough technology in the field of particle size & shape measurement.
By achieving high quality and superior performance, our instruments provide precise analysis results of particle size, particle shape, and powder characteristics, helping scientists and engineers to understand material properties, facilitate research and improve production efficiency.
Bettersize product line for particle size and shape analysis includes instruments of all needs and budgets, from basic to advanced research models. These instruments are widely applied in Pharmaceuticals, Battery materials, Mining and minerals, Metals, Chemicals and Surface coatings, measuring materials with size ranges from nanometer to millimeter.
Focused on technology innovation, instruments manufacturing, application support and after-sales services, Bettersize provides expertise and professional solutions and assures customers the highest confidence in our products.
Sponsored Content Policy: News-Medical.net publishes articles and related content that may be derived from sources where we have existing commercial relationships, provided such content adds value to the core editorial ethos of News-Medical.Net which is to educate and inform site visitors interested in medical research, science, medical devices and treatments.