The Thermo Scientific™ NanoDrop™ Ultra Microvolume UV-Vis Spectrophotometer and Fluorometer employs Thermo Scientific™ Acclaro™ Sample Intelligence Technology. This system incorporates a Contaminant Identification (ID) capable of detecting the existence of common contaminants in both nucleic acid and protein samples.
Nucleic acid purity ratios A260/A230 and A260/A280 have traditionally served as primary resources for assessing sample purity. The acceptable purity ratio ranges for “pure” nucleic acids are summarized in Table 1.
In certain cases, purity ratios may fall within the “pure” range in the presence of a contaminant. This limitation is problematic, as contaminants can artificially inflate sample concentration even though the nucleic acid appears pure, resulting in downstream reaction failures.
Table 1. Acceptable purity ratio ranges for “pure” nucleic acids using a blank and sample buffer at the same pH and ionic strength. Source: Thermo Fisher Scientific – Pharmaceutical and Biopharmaceutical Solutions
| Nucleic acid |
A260/A280 |
A260/A230 |
| DNA |
∼1.8 |
1.8 – 2.2 |
| RNA |
∼2.0 |
1.8 – 2.2 |
To overcome the limitations of purity ratios, the integrated Acclaro Contaminant ID feature in the NanoDrop Ultra tool evaluates individual sample spectra using a reference spectral library and chemometric algorithms. This approach enables the software to predict both the presence and amount of contaminants and to provide a corrected sample concentration (see Figure 1).
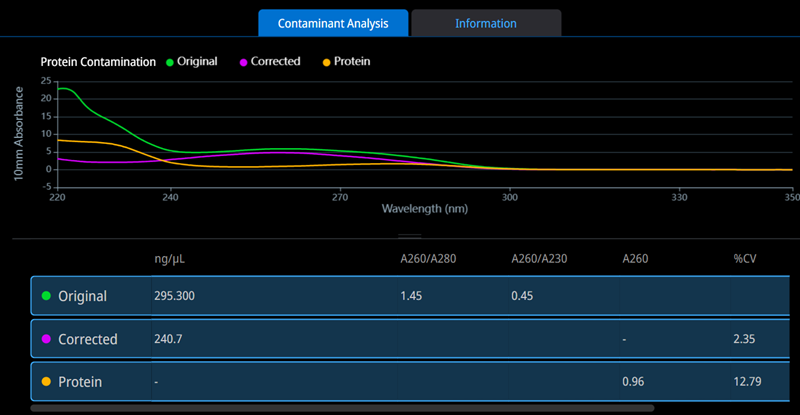
Figure 1. Acclaro Contaminant ID feature identified protein as a contaminant in a dsDNA preparation. The original, uncorrected spectrum is in green, the corrected spectrum is in purple, and the contaminant spectrum is in orange. Image Credit: Thermo Fisher Scientific – Pharmaceutical and Biopharmaceutical Solutions
The Thermo Scientific™ Acclaro™ technology is capable of identifying multiple contaminants in the dsDNA application for samples within a specific concentration range. For protein and phenol detection, dsDNA samples must fall within 25 – 3125 ng/μL to ensure precise predictions by the Acclaro technology (see Table 2).
Table 2. Contaminants detected using the dsDNA, RNA, and Protein A280 applications with their associated sample concentration ranges. Source: Thermo Fisher Scientific – Pharmaceutical and Biopharmaceutical Solutions
| Application |
Detected contaminants |
Sample concentration |
| dsDNA |
Protein, Phenol |
0.5 A – 62.5 A
25 – 3,125 ng/μL |
|
Mammal, Bacteria, Plant RNA |
1.0 A – 20 A
50 – 1,000 ng/μL |
| RNA |
Protein, Phenol, Guanidine Isothiocyanate |
0.5 A – 62.5 A
20 – 2,500 ng/μL |
|
Mammal, Bacteria, Plant DNA |
1.0 A – 20 A
40 – 800 ng/μL |
| Protein A280 |
DNA |
All concentrations |
Experimental procedures
Blends of dsDNA, protein, and phenol were prepared to achieve the final concentrations detailed in Table 3. The dsDNA was created via the dilution of Invitrogen™ UltraPure™ Calf Thymus DNA Solution (Invitrogen, 15633019). Protein and phenol were prepared from a bovine serum albumin solution (BSA, Sigma Aldrich, A7284) and a buffer-saturated stock (Fisher BioReagents, BP1750I), respectively. All mixtures were diluted in tris-EDTA (TE) buffer, pH 7.5, which acted as the blank for the NanoDrop spectrophotometer measurements.
Table 3. A. Final concentrations of phenol and dsDNA mixtures. B. Final concentrations of protein and dsDNA mixtures. Source: Thermo Fisher Scientific – Pharmaceutical and Biopharmaceutical Solutions
| A |
Mixture # |
1 |
2 |
3 |
4 |
5 |
6 |
7 |
| Phenol (ppm) |
1200 |
800 |
400 |
100 |
80 |
60 |
30 |
| dsDNA (ng/μL) |
250 |
250 |
250 |
250 |
250 |
250 |
250 |
| B |
Mixture # |
1 |
2 |
3 |
4 |
5 |
6 |
| Protein (mg/mL) |
10 |
4 |
2 |
0.75 |
0.5 |
0.25 |
| dsDNA (ng/μL) |
250 |
250 |
250 |
250 |
250 |
250 |
A Thermo Scientific™ NanoDrop™ OneC Spectrophotometer was used as the control instrument to compare results generated by the NanoDrop Ultra instrument. For both instruments, fresh 2.0 μL measurements were carried out in replicates of five using the microvolume pedestal with the dsDNA application, where the Acclaro Contaminant ID feature is automatically enabled for both models.
Results
The original and corrected dsDNA concentrations were determined automatically in the experiment report. The mean and standard deviation of each mixture were calculated independently of the software along with average purity ratios (A260/A280 and A260/A230). Table 4 summarizes the results.
The Acclaro Contaminant ID feature accurately identified the protein contamination in a dsDNA sample down to 0.5 mg/mL of protein or 2.5 % (v/v) protein in the mixture. For phenol contamination, the Acclaro technology accurately detected phenol as low as 60 ppm or 1.2 % (v/v) phenol in the mixture. Both the protein and phenol sample sets yielded standard deviations of 5.5 ng/μL and lower, indicating high reproducibility in the calculation of a corrected dsDNA concentration.
Table 4. The original and corrected dsDNA concentrations from the NanoDrop Ultra instrument were averaged from five replicates. Standard deviation was reported for the corrected dsDNA concentration replicates unless marked as Original in the table, for which the standard deviation of the original dsDNA concentration was reported. The Acclaro Contaminant ID icon ( ) indicates the software identified a sample contaminant. Source: Thermo Fisher Scientific – Pharmaceutical and Biopharmaceutical Solutions
| |
Protein contamination |
Phenol contamination |
dsDNA control |
| Contaminant content |
10
mg/
mL |
4
mg/
mL |
2
mg/
mL |
0.75
mg/
mL |
0.5
mg/
mL |
0.25
mg/
mL |
1200
ppm |
800
ppm |
400
ppm |
100
ppm |
80
ppm |
60
ppm |
30
ppm |
- |
Original dsDNA
concentration (ng/μL) |
460.0 |
345.4 |
294.6 |
280.8 |
264.9 |
267.5 |
702.1 |
563.3 |
401.0 |
303.8 |
292.1 |
285.0 |
271.9 |
254.8 |
Corrected dsDNA
concentration (ng/μL) |
293.1 |
267.7 |
240.0 |
259.3 |
250.2 |
- |
278.7 |
274.3 |
256.3 |
264.5 |
274.9 |
259.2 |
- |
- |
Standard deviation of
corrected dsDNA
concentration (ng/μL) |
1.1 |
5.5 |
0.7 |
0.5 |
0.9 |
0.7
(Original) |
5.2 |
1.8 |
0.9 |
0.4 |
1.1 |
0.5 |
1.0
(Original) |
0.4
(Original) |
A260/A280 purity
ratio |
0.87 |
1.26 |
1.46 |
1.68 |
1.74 |
1.82 |
1.65 |
1.86 |
1.79 |
1.83 |
1.83 |
1.84 |
1.85 |
1.87 |
A260/A230 purity
ratio |
0.41 |
0.30 |
0.45 |
0.85 |
1.06 |
1.49 |
1.97 |
2.15 |
2.16 |
2.26 |
2.27 |
2.29 |
2.31 |
2.34 |
| Acclaro Flag |
|
|
|
|
|
No |
|
|
|
|
|
|
No |
No |
Purity ratios for the phenol-contaminated samples remained largely within the acceptable limits outlined in Table 1. This highlights the necessity of using the Acclaro Contaminant ID feature to identify contaminants that might not affect the purity ratios. Figure 2 outlines the percent error of the corrected dsDNA concentration obtained from the NanoDrop Ultra instrument relative to the theoretical concentration for each sample.
All corrected concentrations fell within the 20 % error threshold of the Acclaro Contaminant ID technology. The largest error was 17.2 % for the highest concentration of protein contamination (10 mg/mL). Most samples exhibited an error of less than 10 % from the theoretical concentration, verifying the accuracy of the corrected dsDNA concentration.
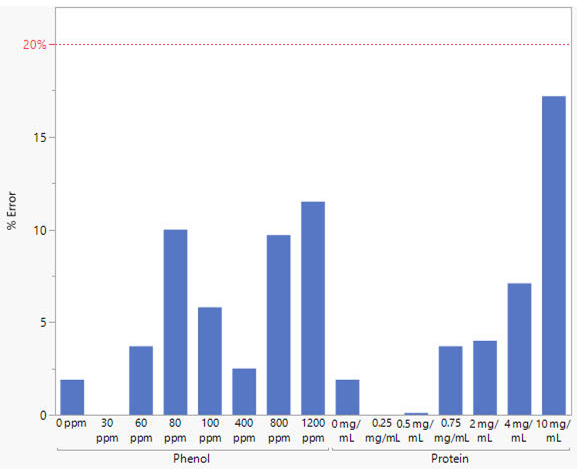
Figure 2. Percent error of the corrected dsDNA concentration from the NanoDrop Ultra instrument compared to the theoretical concentration. The red, dashed line denotes the 20 % error limit of the Acclaro Contaminant ID feature. Bars are absent from the 30 ppm and 0.25 mg/mL samples as they were not flagged by Acclaro technology. Zero ppm and mg/mL represent the control dsDNA sample using the original concentration. Image Credit: Thermo Fisher Scientific – Pharmaceutical and Biopharmaceutical Solutions
Figure 3 presents a comparison between the original, uncorrected concentrations and the Acclaro-corrected concentrations. The uncorrected concentrations increased as protein and phenol concentrations increased, highlighting the influence of contamination on dsDNA concentration. After using the Acclaro technology to subtract contaminants from the UV spectrum, the corrected concentrations remained within the ± 20 % error limit.
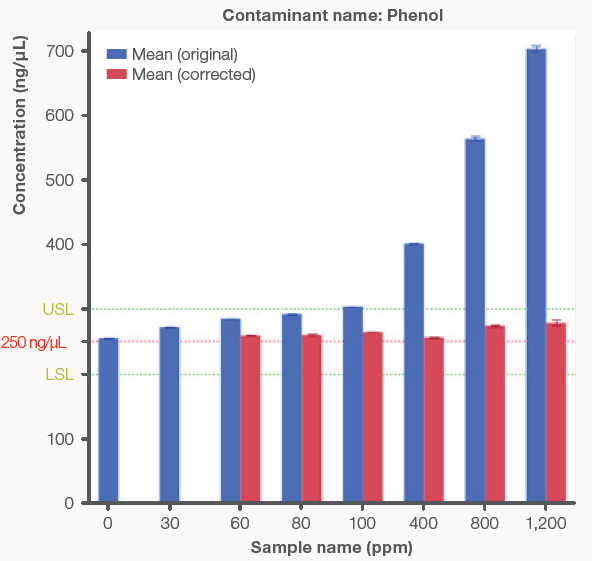
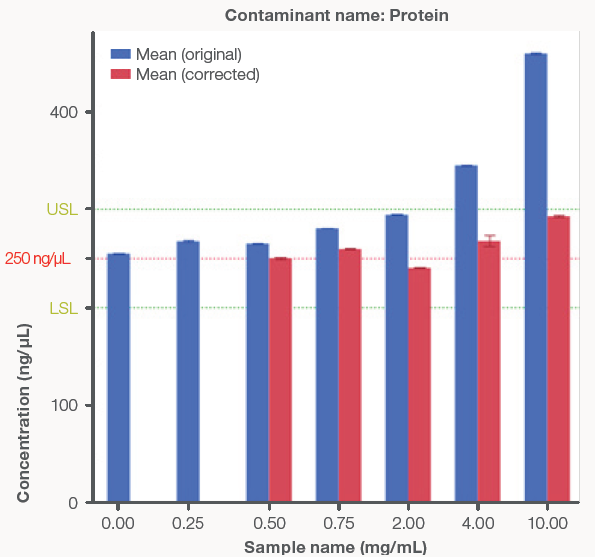
Figure 3. Bar graphs comparing the original, uncorrected dsDNA concentrations (blue bars) to the Acclaro-corrected concentrations (red bars) from the NanoDrop Ultra instrument. The red line represents the theoretical dsDNA concentration of 250 ng/μL and the green lines represent ± 20 % error from the theoretical concentration to account for the Acclaro Contaminant ID algorithm error. Zero ppm and mg/mL represent the control dsDNA sample using the original concentration. A) Phenol contaminated samples. B) Protein contaminated samples. Error bars represent ± one standard deviation from the mean. Image Credit: Thermo Fisher Scientific – Pharmaceutical and Biopharmaceutical Solutions
The Acclaro-corrected dsDNA concentrations from the NanoDrop OneC and NanoDrop Ultra spectrophotometers are compared in Figure 4. For three samples, 60 ppm, 0.5 mg/mL, and 0.75 mg/mL, the NanoDrop Ultra software successfully determined a corrected concentration, whereas the NanoDrop OneC software did not. This sensitivity allows for accurate reporting of low contaminant concentrations using Acclaro technology on the NanoDrop Ultra instrument.
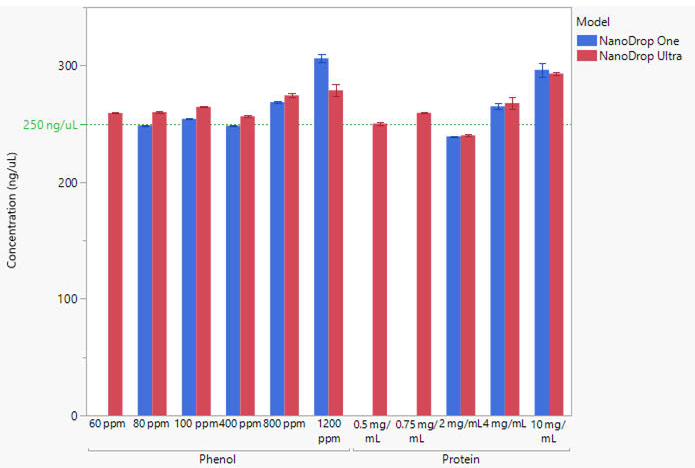
Figure 4. Comparison of Acclaro-corrected concentrations reported by the NanoDrop OneC (blue bars) and NanoDrop Ultra (red bars) spectrophotometers. The Acclaro technology on the NanoDrop OneC instrument did not flag a contaminant for samples without blue bars. The green line represents the theoretical concentration of 250 ng/μL. Error bars represent ± one standard deviation from the mean. Image Credit: Thermo Fisher Scientific – Pharmaceutical and Biopharmaceutical Solutions
Conclusions
Nucleic acid purity ratios have historically provided the best indication of sample purity. Various contaminants, including salts, buffers, proteins, and polysaccharides, can impact purity ratios in similar ways, complicating the identification and quantification of contaminants based solely on these ratios.
To address this constraint, the Acclaro Sample Intelligence Contaminant ID technology employs chemometric algorithms and contaminant spectral libraries to assess subtle alterations in sample spectra and predict contaminant presence. The NanoDrop Ultra spectrophotometer accurately identified protein and phenol contamination down to 2.5 % (v/v) and 1.2 % (v/v), respectively, with an average corrected concentration percent error of 6.8 % compared to theoretical.
This capability provides valuable insights into purification protocols and the stages where contaminants are typically introduced, enabling protocol adjustments to prevent failed downstream reactions. The Acclaro technology integrated into the NanoDrop Ultra instrument eliminates the guesswork from troubleshooting contaminant presence, serving as a powerful instrument for life science laboratories.
About Thermo Fisher Scientific – Pharmaceutical and Biopharmaceutical Solutions
Overview
With over five decades of innovation in spectroscopy, materials characterization, and process analytics, Thermo Fisher Scientific empowers pharmaceutical and biopharmaceutical manufacturers to bring therapies to patients faster - safely, compliantly, and efficiently.
Our portfolio of Thermo Scientific™ instruments and software supports every stage of the molecule lifecycle, from discovery through commercial manufacturing. From early molecular profiling to process analytical technology (PAT) and final quality release, our integrated solutions help ensure data integrity, process efficiency, and regulatory confidence.
We work in partnership with the pharmaceutical industry to apply advanced technologies in ways that enable manufacturers to have better information and control over their processes. From raw material identification through manufacturing operations to finished and packaged pharmaceutical product inspection, we offer a complete range of technologies and business solutions that can help improve each stage of the production process, gain efficiencies, and deliver a higher quality product to the end-consumer.
Solutions across the drug lifecycle
Research & discovery
Accelerate discovery with high-sensitivity, low-volume analytical tools that deliver reproducible data even from scarce samples. Our NanoDrop™ microvolume spectrophotometers and fluorometers, GENESYS™ Vis/UV-Vis Spectrophotometers and Evolution™ UV-Vis Spectrophotometer instruments, and DXR™ SmartRaman spectrometers provide rapid molecular insight and material identification, supporting target validation and early screening. These technologies give researchers the confidence to make faster go/no-go decisions and strengthen the foundation for scale-up and compliance.
Formulation & process development
Scale from grams to pilot batches with confidence. Bench-scale extruders, rheometers, and FT-NIR analyzers help optimize formulations, assess stability, and ensure consistent API dispersion. Complementary XRD and FTIR systems identify polymorphs and crystallinity to improve solubility and bioavailability - critical for modern dosage form design. Each platform is built to align with Quality by Design (QbD) principles and 21 CFR Part 11 requirements, streamlining regulatory submission and method transfer.
Clinical and commercial manufacturing
Ensure process reliability and product quality at scale. Inline and at-line process analyzers - such as the MarqMetrix™ All-In-One Raman, Prima BT/PRO Process Mass Spectrometers, and Antaris™ II FT-NIR - enable real-time PAT monitoring for consistent production. Handheld TruScan™ G3 analyzers provide non-destructive raw material verification through sealed packaging, reducing sampling delays and ensuring regulatory compliance. Our inline inspection systems (X-ray, checkweighers, and metal detectors) protect final product integrity through fill, finish, and packaging.
Quality control & regulatory confidence
Thermo Scientific analytical platforms are backed by validated, GMP- and 21 CFR Part 11–ready software suites, including OMNIC™ Paradigm and Security Suite, ensuring data traceability, audit readiness, and compliance across global operations. Our technologies help pharmaceutical teams maintain alignment with USP, EP, and FDA standards while safeguarding data integrity from research to release.
Services & support
We provide comprehensive service and support to help minimize cost of ownership, maximize uptime, and maintain compliance. Our tiered plans include preventive maintenance, priority response, calibration, and remote monitoring to keep operations running efficiently. Order OEM-compliant spare parts directly from Thermo Fisher with confidence in their quality and compatibility and rely on our global technical support network to reduce downtime across spectroscopy, extrusion, compounding, process analysis, and inspection systems.
Thermo Fisher Scientific: Partnering across the drug lifecycle
From ideation to delivery, we enable our partners to innovate faster, protect yield and quality, ensure compliance, and deliver therapies with confidence.
Sponsored Content Policy: News-Medical.net publishes articles and related content that may be derived from sources where we have existing commercial relationships, provided such content adds value to the core editorial ethos of News-Medical.net, which is to educate and inform site visitors interested in medical research, science, medical devices and treatments.