Using just 1.0 – 2.0 μL measurement volumes, the Thermo Scientific™ NanoDrop™ Ultra Microvolume UV-Vis Spectrophotometers and Fluorometers deliver both qualitative and quantitative data on nucleic acid and protein samples. UV-Vis spectrophotometry is a reliable analytical method in biopharmaceutical manufacturing facilities, serving as a critical quality control checkpoint.
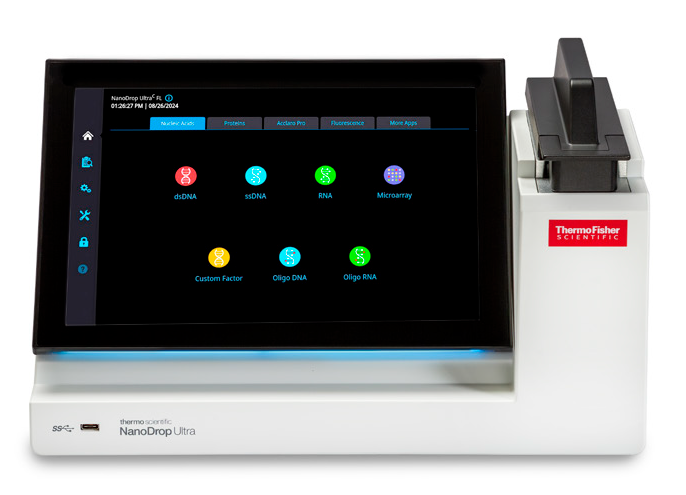
Image Credit: Thermo Fisher Scientific – Pharmaceutical and Biopharmaceutical Solutions
For cuvette-based spectrophotometric measurements, this checkpoint may require multiple serial dilutions to obtain an absorbance within the instrument’s dynamic range, thereby introducing unwanted errors. Biologics manufacturing often produces highly concentrated solutions, making serial dilutions a common and time-consuming step in the workflow.
To address these obstacles, the Thermo Scientific™ Acclaro™ Pro software, an optional add-on for NanoDrop Ultra instrument models, employs a sophisticated algorithm to enhance sample quantification precision. The Acclaro Pro software supports an absorbance measurement precision of ± 5 % error for highly concentrated biomolecules - as high as 550 absorbance units (10 mm equivalent) or 400 g/L IgG, 18,150 ng/μL ssDNA.
For monoclonal antibody (mAb) drugs, precise protein concentration is critical at multiple stages to ensure optimal yield and purity. Validated protein concentrations are essential for proper loading of chromatography columns, assessing process efficiency, and avoiding instability in the final product. The Acclaro Pro software delivers highly precise concentration results in under 30 seconds per measurement without requiring expensive consumables or dilutions.
Method
A full mAb downstream purification train was carried out using multiple chromatography and filtration techniques. Aliquots were reserved at each stage for spectrophotometric evaluation, and sample names are listed in Table 1. Except for the ultrafiltration and diafiltration (UF/DF) operation, all chromatography and filtration techniques utilized the Thermo Scientific™ DynaChrom™ Chromatography System.
Protein A chromatography (ProA) was conducted using the MabCaptureC™ Affinity Resin (Thermo Scientific, 1963662250), effectively eliminating logs of harvest impurities including host cell proteins (HCPs) and DNA while retaining the target mAb in large quantities.
Several ProA cycles were carried out, and the protein A eluates from each cycle were pooled together (ProA Pool). Viral inactivation (VI) was then conducted on the ProA pool to ensure viral clearance. Depth filtration (DF) and single-pass tangential flow filtration (SPTFF) capsule assembly were conducted in series to further eliminate impurities and concentrate the mAb pool to decrease product volumes.
In the next stage, anion exchange chromatography (AEX) was performed using the POROS™ XQ Strong Anion Exchange Resin (Thermo Scientific, 4467820). This step was operated inline with an SPTFF capsule assembly, allowing for the removal of residual HCP and further concentration of the AEX product.
Cation exchange chromatography (CEX) was subsequently conducted with the POROS™ XS Strong Cation Exchange Resin (Thermo Scientific, 4404336) to resolve the target mAb from aggregated species, completing the chromatography stages of the downstream process. A Quattroflow 1200S pump was utilized to concentrate and formulate the CEX pool, and the product pool was run through a Thermo Scientific™ HyPerforma™ Single-Use Mixer.
Aliquots were reserved after the initial ultrafiltration (Post UF), after diafiltration (Post DF), and from both primary and secondary UF/DF recoveries. The primary and secondary recoveries were pooled (UF/DF Pool) and then formulated to the target bulk drug substance (BDS Product) concentration.
Table 1. Sample aliquots reserved at each mAb processing stage. Source: Thermo Fisher Scientific – Pharmaceutical and Biopharmaceutical Solutions
| Stage in process |
Description |
| ProA Pool |
mAbs pooled from protein A chromatography |
| Post VI |
Post viral inactivation |
| Post DF/SPTFF |
Post diafiltration / single-pass tangential flow filtration |
| Post AEX/SPTFF |
Post POROS XQ Strong Anion Exchange / single-pass tangential flow filtration |
| CEX Pool |
mAbs pooled from POROS XS Strong Cation Exchange |
| Post UF |
Post ultrafiltration |
| Post DF |
Post diafiltration |
| UF/DF Primary Recovery |
First pass ultrafiltration/diafiltration |
| UF/DF Secondary Recovery |
Second pass ultrafiltration/diafiltration |
| UF/DF Pool |
Pooled mAbs from primary and secondary recovery ultrafiltration/diafiltration |
| BDS Product |
Final bulk drug substance |
At each step, the mAbs were measured using both a comparable high-concentration UV-Vis instrument and a NanoDrop UltraC spectrophotometer equipped with the Acclaro Pro Protein A280 application and the custom E1 % mass extinction coefficient of 14.0 (g/100 mL)-1 cm-1, with baseline correction set to 320 nm.
The NanoDrop UltraC tool was blanked with phosphate-buffered saline (PBS) for all samples except for the UF/DF Pool and BDS Product. For these samples, the matrix buffer, consisting of histidine, arginine, and sucrose, was used as the blank. No blank was necessary for the comparable UV-Vis instrument. Samples for both instruments were measured in triplicate using a “replicate” format, requiring a new aliquot for each of the three triplicate samples.
The average and coefficient of variation (%CV) were determined from triplicate measurements, and average concentrations were assessed against the comparable UV-Vis instrument to calculate the percent difference. Triplicate measurements from both instruments were timed using a stopwatch to quantify variations in measurement time, from aliquoting the first sample to completing the experiment.
In addition, 3.678 g KHP was added to 40 mL of deionized water (diH2O) to create a solution of potassium hydrogen phthalate (KHP). To assess the complete range of the Acclaro Pro software, dilutions were prepared to achieve absorbance values of 400 A, 300 A, 200 A, 100 A, and 75 A at 280 nm (292 g/L – 55 g/L IgG equivalent).
To assess Acclaro Pro software accuracy, a Thermo Scientific™ Evolution™ Pro UV-Vis Spectrophotometer was used as the reference instrument. Stock KHP samples were diluted 1:1000 and measured in a 1.0 cm quartz cuvette. The absorbance at 280 nm was measured using a 1.0 nm bandwidth and a 1.0 second integration time.
Results
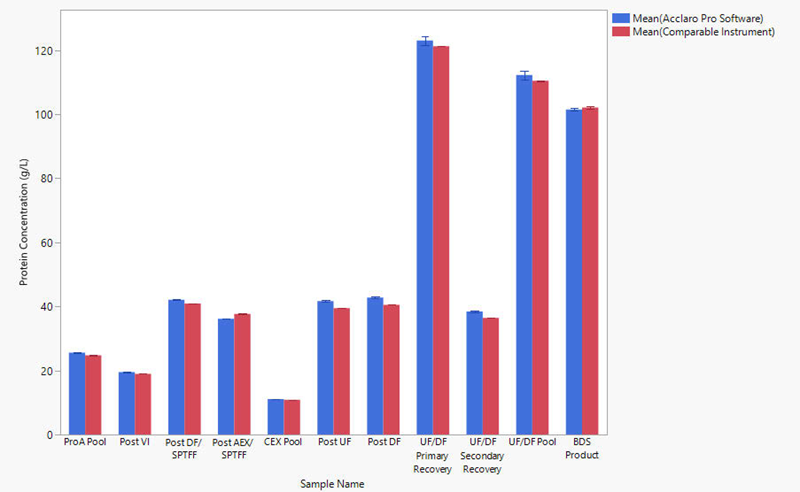
Figure 1. Average concentration (n=3) of mAbs obtained from each stage of production. Blue bars represent concentrations reported by the NanoDrop Ultra Acclaro Pro software. Red bars represent concentrations reported by a comparable UV-Vis spectrophotometer. error bars represent one standard deviation from the mean. Image Credit: Thermo Fisher Scientific – Pharmaceutical and Biopharmaceutical Solutions
Since absorbance spectrophotometry is generally an analytical technique applied to highly purified products, concentration results and percent difference for just the UF/DF and BDS samples are summarized in Table 2. The table presents findings from both a comparable spectrophotometer and a NanoDrop UltraC spectrophotometer employing the Acclaro Pro software.
Concentration measurements reported by the Acclaro Pro software demonstrate exceptional reproducibility, with a standard deviation of ≤ 1.4 g/L. The percent difference between the comparable instrument with its software and the NanoDrop Ultra instrument with Acclaro Pro software was below 2 % for most samples.
The higher percent difference (5.5 %) observed in the Secondary Recovery sample may be attributed to the use of PBS as the blank rather than the matrix buffer for the UF/DF Primary and Secondary Recovery samples. This finding highlights the necessity of making an appropriate blank measurement composed of the same buffer in which the sample is suspended.
Total triplicate measurement time, from aliquoting the first sample to completing the experiment, was 2 minutes 22 seconds with the Acclaro Pro software and 7 minutes and 20 seconds with the comparable instrument. Since the Acclaro Pro software measures triplicates three times faster, it is ideally suited for evaluating large numbers of samples.
Table 2. Average concentrations, standard deviations, and percent differences of mAbs at separate purification stages, measured in triplicate on a comparable UV-Vis spectrophotometer and a NanoDrop UltraC spectrophotometer utilizing the Acclaro Pro software. Source: Thermo Fisher Scientific – Pharmaceutical and Biopharmaceutical Solutions
| |
Comparable UV-Vis Instrument |
NanoDrop Ultra Acclaro Pro Software |
|
Sample
Name |
Average
(g/L) |
Standard
Deviation (g/L) |
Average
(g/L) |
Standard
Deviation (g/L) |
Percent
Difference |
UF/DF Primary
Recovery |
121.2 |
0.04 |
123.0 |
1.4 |
1.5 % |
UF/DF Secondary
Recovery |
36.4 |
0.02 |
38.5 |
0.03 |
5.5 % |
| UF/DF Pool |
110.5 |
0.10 |
112.3 |
1.3 |
1.6 % |
| BDS Product |
102.1 |
0.4 |
101.5 |
0.04 |
0.6 % |
The KHP dilutions measured using the Evolution Pro spectrophotometer and the NanoDrop UltraC spectrophotometer with the Acclaro Pro software are compared in Figure 2 and summarized in Table 3. The R2 value of the regression line is 1.000, indicating a strong correlation between absorbance measurements. The precision of the Acclaro Pro software is further supported by the percent differences for each sample in Table 3, which were 4.9 % or lower for all samples, within the 5 % specification for the Acclaro Pro software.
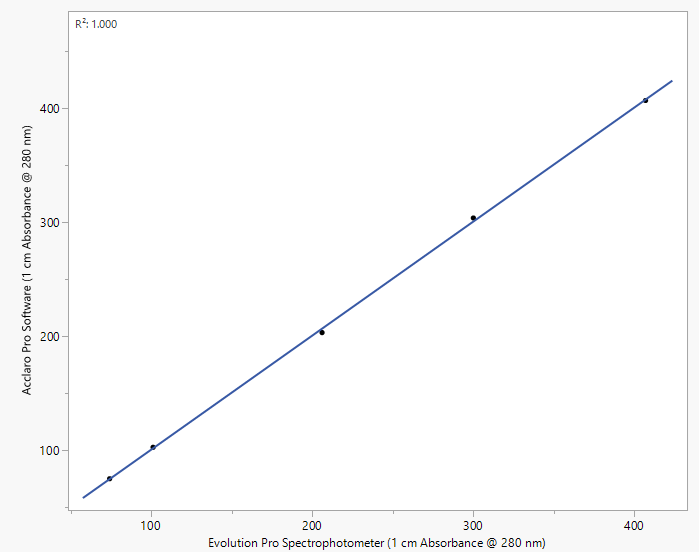
Figure 2. Comparison of absorbance at 280 nm reported by an Evolution Pro spectrophotometer and a NanoDrop UltraC spectrophotometer utilizing the Acclaro Pro software (R2=1.000). Absorbance results from the Evolution Pro instrument were multiplied by a dilution factor. Image Credit: Thermo Fisher Scientific – Pharmaceutical and Biopharmaceutical Solutions
Table 3. Average absorbances, standard deviations, and percent differences for dilutions of KHP, measured on an Evolution Pro spectrophotometer (n=1, 1:1000 dilution) and a NanoDrop UltraC spectrophotometer utilizing the Acclaro Pro software (n=5). Percent differences are compared to the Evolution Pro spectrophotometer. Source: Thermo Fisher Scientific – Pharmaceutical and Biopharmaceutical Solutions
| |
Evolution Pro Spectrophotometer |
NanoDrop Ultra Acclaro Pro Software |
KHP
Dilution |
Abs @
280 nm |
Average
(Abs @ 280 nm) |
Standard
Deviation |
Percent
Difference |
| 400 A |
407.0 |
402.7 |
2.1 |
1.1 % |
| 300 A |
300.0 |
305.2 |
1.8 |
1.7 % |
| 200 A |
206.0 |
201.3 |
1.7 |
2.3 % |
| 100 A |
101.0 |
103.6 |
1.8 |
2.5 % |
| 75 A |
74.0 |
77.7 |
1.8 |
4.9 % |
Conclusion
The Acclaro Pro software for the NanoDrop Ultra spectrophotometers and fluorometers has been proven to deliver highly accurate absorbance and concentration outcomes up to 550 absorbance units (400 g/L IgG, 18,150 ng/μL ssDNA).
To ensure results remain within the specified concentration accuracy range (± 5 % error), the spectrophotometer should be blanked using the same buffer in which the sample is suspended and purified biomolecules should be utilized.
The NanoDrop Ultra instrument paired with the Acclaro Pro software can be readily integrated into oligonucleotide or antibody production workflow thanks to its small footprint (32 x 18 x 28 cm), low 1 – 2 μL sample volume requirement, elimination of dilution steps, lack of consumables, and rapid measurement time.
About Thermo Fisher Scientific – Pharmaceutical and Biopharmaceutical Solutions
Overview
With over five decades of innovation in spectroscopy, materials characterization, and process analytics, Thermo Fisher Scientific empowers pharmaceutical and biopharmaceutical manufacturers to bring therapies to patients faster - safely, compliantly, and efficiently.
Our portfolio of Thermo Scientific™ instruments and software supports every stage of the molecule lifecycle, from discovery through commercial manufacturing. From early molecular profiling to process analytical technology (PAT) and final quality release, our integrated solutions help ensure data integrity, process efficiency, and regulatory confidence.
We work in partnership with the pharmaceutical industry to apply advanced technologies in ways that enable manufacturers to have better information and control over their processes. From raw material identification through manufacturing operations to finished and packaged pharmaceutical product inspection, we offer a complete range of technologies and business solutions that can help improve each stage of the production process, gain efficiencies, and deliver a higher quality product to the end-consumer.
Solutions across the drug lifecycle
Research & discovery
Accelerate discovery with high-sensitivity, low-volume analytical tools that deliver reproducible data even from scarce samples. Our NanoDrop™ microvolume spectrophotometers and fluorometers, GENESYS™ Vis/UV-Vis Spectrophotometers and Evolution™ UV-Vis Spectrophotometer instruments, and DXR™ SmartRaman spectrometers provide rapid molecular insight and material identification, supporting target validation and early screening. These technologies give researchers the confidence to make faster go/no-go decisions and strengthen the foundation for scale-up and compliance.
Formulation & process development
Scale from grams to pilot batches with confidence. Bench-scale extruders, rheometers, and FT-NIR analyzers help optimize formulations, assess stability, and ensure consistent API dispersion. Complementary XRD and FTIR systems identify polymorphs and crystallinity to improve solubility and bioavailability - critical for modern dosage form design. Each platform is built to align with Quality by Design (QbD) principles and 21 CFR Part 11 requirements, streamlining regulatory submission and method transfer.
Clinical and commercial manufacturing
Ensure process reliability and product quality at scale. Inline and at-line process analyzers - such as the MarqMetrix™ All-In-One Raman, Prima BT/PRO Process Mass Spectrometers, and Antaris™ II FT-NIR - enable real-time PAT monitoring for consistent production. Handheld TruScan™ G3 analyzers provide non-destructive raw material verification through sealed packaging, reducing sampling delays and ensuring regulatory compliance. Our inline inspection systems (X-ray, checkweighers, and metal detectors) protect final product integrity through fill, finish, and packaging.
Quality control & regulatory confidence
Thermo Scientific analytical platforms are backed by validated, GMP- and 21 CFR Part 11–ready software suites, including OMNIC™ Paradigm and Security Suite, ensuring data traceability, audit readiness, and compliance across global operations. Our technologies help pharmaceutical teams maintain alignment with USP, EP, and FDA standards while safeguarding data integrity from research to release.
Services & support
We provide comprehensive service and support to help minimize cost of ownership, maximize uptime, and maintain compliance. Our tiered plans include preventive maintenance, priority response, calibration, and remote monitoring to keep operations running efficiently. Order OEM-compliant spare parts directly from Thermo Fisher with confidence in their quality and compatibility and rely on our global technical support network to reduce downtime across spectroscopy, extrusion, compounding, process analysis, and inspection systems.
Thermo Fisher Scientific: Partnering across the drug lifecycle
From ideation to delivery, we enable our partners to innovate faster, protect yield and quality, ensure compliance, and deliver therapies with confidence.
Sponsored Content Policy: News-Medical.net publishes articles and related content that may be derived from sources where we have existing commercial relationships, provided such content adds value to the core editorial ethos of News-Medical.net, which is to educate and inform site visitors interested in medical research, science, medical devices and treatments.