James Ives, M.Psych, speaks to Jessica Geisler from Eppendorf North America about the applications of spectrophotometry in the life sciences and the demand for flexible spectrophotometers that can handle a range of measurement types.
Can you please give me a brief overview of spectrophotometry? How is it used and how does spectrophotometry vary?
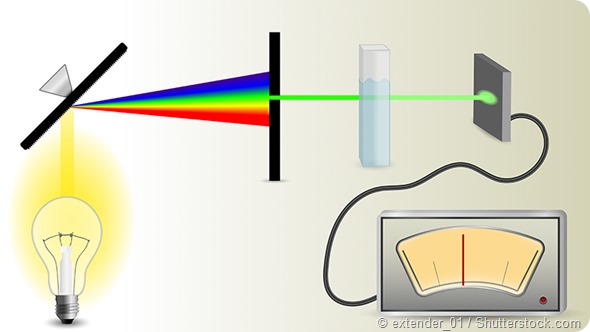
Spectrophotometry quantifies the concentration of a specific substance that is present in a sample by comparing the amount of light that goes into a sample versus the amount of light that comes out of the sample at a specific wavelength.

The amazing thing about spectrophotometry is that it can theoretically be used to measure any substance that absorbs light. For instance, spectrophotometry can quantify nucleic acids, proteins and bacterial density, but it also can measure bitterness compounds (IBUs, international bitterness units) in brewed beer!
Spectrophotometry primarily varies by the type of light being measured and the wavelength selection of the instrument. First, either UV/Vis (ultraviolet/visible) light or florescent light can be utilized in spectrophotometry.
A specific wavelength of UV/Vis light can be utilized to directly determine the concentration of a substance, or the emission of fluorescent light can be used to indirectly determine the concentration of a specific molecule.
Additionally, spectrophotometry can vary in regards to how wavelengths are selected, either filter-based or monochromator. Filter-based instruments use optical filters to select for the wavelength of interest and consequently filter out all other wavelengths.
Monochromator instruments use diffraction gratings to select the desired wavelengths. Both type of instruments have their benefits, filter-based have higher sensitivity and lower detection limits, while monochromatic instruments have scanning capability and wavelength flexibility.
What are the research applications of spectrophotometry, in which industries is spectrophotometry used? Why is spectrophotometry used over other chemical classification methods?
Spectrophotometry is most commonly used in biomedical and life science research, which includes both academic and industrial research. Typical spectrophotometry applications are the measurements of nucleic acids, proteins and bacterial density.

However, spectrophotometry is also widely utilized in a variety of industries including biotechnology, diagnostic and clinical testing, drug discovery, pharmaceutical research, chemical engineering, material science and agricultural research.
Chemical classification methods distinguish compounds according to their structural properties, commonly by assessing physical properties (molecular weight, electrical charge, solubility, pH) or chemical or biological function.
Spectrophotometry quantifies the concentration of compounds at one or a variety of wavelengths. Thus, the researcher would select between chemical classification methods or spectrophotometry depending on the type of information that they want to obtain from the substance.
If they are interested in molecular properties or functionality of a molecule, chemical classifications would be more appropriate. Conversely, if the research is interested in assessing the concentration of the substance at one of more wavelengths, then spectrophotometry would be the better choice.
What is the difference between microvolume vs. cuvette based measurements? What differences are there in research applications?
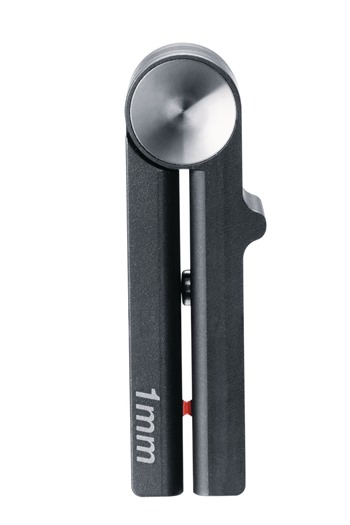
Microvolume measurements typically range from 1µl to 10µl while cuvette based measurements can range from 50µl to greater than 1ml.
.jpg)

Selecting between a microvolume measurement versus a cuvette based measurement will depend on the concentration of the sample and the type of molecule’s being measured. Microvolume measurements, with significantly shorter path lengths (<1 mm), are accurate at higher concentrations, while cuvette based measurements, with much longer path lengths (approx. 10mm), are accurate at much lower concentrations.
For the most accurate results, it is important to select the appropriate volume. Additionally, when there is a precious or limited sample it is always best to select a microvolume measurement, so less volume is consumed for spectrophotometry measurements. On the other hand, using a cuvette based measurement is beneficial when measuring heterogeneous sample like bacteria in OD600 measurements. A longer, cuvette based pathlength will generate a more accurate and reproducible result.
What is the difference between UV/Vis vs. fluorescence measurements?
UV/Vis measurements occur in the ultraviolet (UV) and visible portion of the electromagnetic spectrum. UV/Vis measurements can directly measure the concentration of a molecule with a known extinction coefficient or indirectly measure a concentration utilizing a standard curve.
Fluorescence measurements require the presence of a fluorophore tagged to a specific molecule of interest. In order to detect the concentration of the molecule of interest, the attached fluorophore is initially excited by absorbing photons of energy from a high energy wavelength light source (excitation light), and consequently emits energy in the form fluorescence at a lower energy wavelength light source. Fluorescence measurements are indirect and consequently require a standard curve.
What spectrophotometers do Eppendorf NA produce? What makes Eppendorf’s spectrophotometers unique?
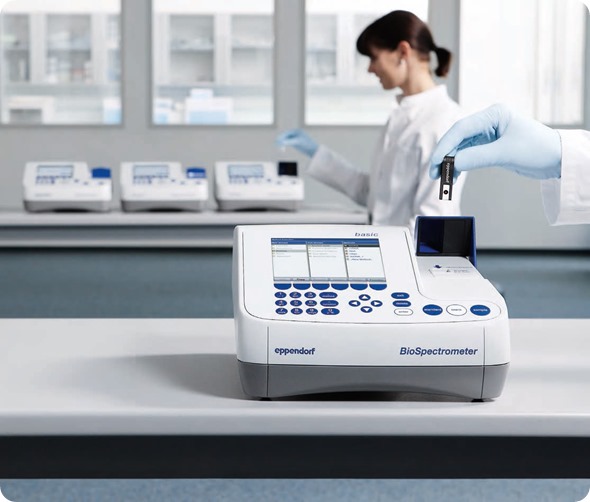
Eppendorf North America has two different lines in our detection product family (1) a fixed wavelength photometer, the BioPhotometer D30, and (2) a family of scanning spectrophotometers, the BioSpectrometers. The BioSpectrometer family includes three variants: BioSpectrometer basic, BioSpectrometer kinetic and BioSpectrometer fluorescence.

Eppendorf’s BioSpectrometer family has a variety of unique features. All BioSpectrometers are stand alone devices that measure and scan in the 200-830 nm spectral range with guided in-unit software that is pre-programmed for common cell biology, molecular biology and microbiology applications.
They come with a long-life xenon flash lamp, an impressive results memory (more than >1000 results can be stored on the device) and integrated data processing and scan analysis that are performed directly on the unit.
Both microvolume and cuvette-based measurements can be conducted in all BioSpectrometers. These features hold true for all BioSpectrometers: the BioSpectrometer basic, the BioSpectrometer kinetic and the BioSpectrometer fluorescence.
In addition to the features and functions previously mentioned, the BioSpectrometer kinetic also contains an integrated peltier element in the cuvette shaft for freely selectable temperature control (0.1°C range: +20°C to +42°C). The BioSpectrometer kinetic can also perform time-dependent measurements, with or without temperature control.
Similarly, the BioSpectrometer fluorescence also possesses the universal features and functions of the BioSpectrometer family in addition to fluorescence capabilities. The BioSpectrometer fluorescence has filter-based fluorescence abilities with an excitation filter at 470 nm and emission filters at 520 nm and 560 nm.
These emission wavelengths are ideally suited for the measurements associated with common commercially available nucleic and protein fluorescence measurement kits.
What are the limitations of spectrophotometry? How is Eppendorf attempting to overcome these limitations?
One limitation to spectrophotometry is the linearity of Beer-Lambert’s Law, which can deviate from molecules’ behavior in reality. Eppendorf overcomes this issue by providing a number of evaluation procedures including linear regression and linear interpolation as well as quadratic regression, cubical regression, and spline interpolation to best suit the data at hand.
Another limitation of spectrophotometry is that a measurement at a single wavelength only provides a snapshot of the substances present in the sample. Eppendorf overcomes this issue by providing freely scanning options in the 200 to 830 nm wavelength range, which allows for a complete spectrophotometric analysis of all absorbing substances within the sample.
Additionally, all nucleic acids (double stranded DNA, single stranded DNA, RNA, oligomers, primers) absorb at the same wavelength, 260 nm. Consequently, a UV/Vis measurement at 260 nm will not differentiate between these diverse forms of nucleic acids. Eppendorf overcomes this issue by providing a fluorescence variant within the BioSpectrometer family.
Fluorescence spectroscopy is superior in differentiating between the different forms of nucleic acids because fluorophores, available in commercial kits, selectively bind to only one type of nucleic acid allowing for the detection of only that specific nucleic acid. Utilizing fluorescent molecules allows for the differentiation between the different types of nucleic acids present within a single sample.
The BioSpectrometer fluorescence is pre-programmed for such commercially available fluorescence nucleic acid kits, which enables the precise and accurate measurements of specific nucleic acids.
Similarly, UV/Vis spectrophotometry is unable to detect very low concentrations of biomolecules. This is another common spectrophotometric limitation that Eppendorf is able to overcome with the BioSpectrometer fluorescence, by utilizing fluorescence detection and amplification at low concentrations.
What future innovations do you hope to see to further enhance the field of spectrophotometry?
I hope that future spectrophotometers will be “upgradeable”, so as technology continues to rapidly evolve, the instruments themselves will be able to evolve as well. Spectrophotometers are a long-term investment for a laboratory and can have up to a 10 to 15 year lifetime.
Of course, technology and accepted methods will change over this course of time. Thus, I see it as beneficial to create flexible instruments that can be continually updated, both in terms of hardware and software, as necessary to keep up with the pace of research.
What does the future hold for Eppendorf NA?
As the manufacturer of the first commercial photometer in 1950, Eppendorf North America is currently re-establishing our role as the front runner in the detection field with a variety of photometers, spectrophotometers, accessories and consumables that exquisitely demonstrate Eppendorf’s innovative engineering and user-friendly design for superior results.
We are continuing the develop our customer base in the molecular biology, cell biology and microbiology, but are continuing to seed our flexible instruments into other applied fields such as the food and beverage industry (specifically breweries and vineyards), the pharmaceutical industry, agricultural biotechnology, and drug discovery.
Where can readers find more information?
About Jessica Geisler
 Jessica Geisler is the product manager overseeing PCR, Detection, Cell Technology and Cell Imaging at Eppendorf North America.
Jessica transitioned out of academia after her PhD in Pharmacology from the University of Virginia in 2013 and recently was awarded the 2014 Eppendorf Marketing Support of the Year.