The coronavirus disease-19 (COVID-19), which is caused by the severe acute respiratory syndrome coronavirus 2 (SARS-CoV-2), has caused the greatest loss of life due to infectious disease over the last 100 years. Since SARS-CoV-2 originally emerged in December 2019, it has infected more than 216 million and caused the deaths of over 4.5 million worldwide.
The current study extracts available data from the first two waves in various countries to prepare for the future surge in cases in India. The aim was to promote preparedness and thus avert the worst outcomes.
 Study: Dynamics Of the Third Wave, Modelling COVID-19 Pandemic with An Outlook Towards India. Image Credit: Mr Subir Halder / Shutterstock.com

 *Important notice: medRxiv publishes preliminary scientific reports that are not peer-reviewed and, therefore, should not be regarded as conclusive, guide clinical practice/health-related behavior, or treated as established information.
About the study
The researchers of the current study examined data from 15 countries around the world, of which eight have already experienced the third wave. A wide range of population sizes, climates, and healthcare infrastructures was included to allow for the effects of these factors on infection rates.
Data were collected until April 25, 2021, using specified parameters to determine the day when the first wave began and ended in any given country, as well as the start and end dates of their second waves.
Study findings
In the second wave, the infection rate was almost four times higher than that of the first wave. This observation, therefore, indicates that SARS-CoV-2 had mutated during the second wave to resist neutralization and enhance its transmissibility.
The mortality rate did not show a corresponding increase during the second wave; however, the virulence of the second variant apparently declined when considering that the death rate declined in most countries. The researchers caution that this assumption may change, as the second wave is still underway in several countries.
The danger to life and health was more acute during the third wave, as shown by the fact that the rate of infection went up further to 1.7 times that of the second wave and 6.2 times that of the first. The death rate in nations that experienced the third wave was 1.2 times lower than the second wave, and approximately half that of the first wave.
The third wave is far from over, however, in most countries, which may indicate a final infection rate for this wave that is even higher than 6.2 times that of the first wave. One early sign is the 20-fold rise in the infection rate during the third wave in Japan, where the fourth wave is imminent.
Infection peak during each wave
The scientists estimated the highest number of infections per day in each wave and compared them to each other. This shows that the second wave peak was approximately three times higher than that of the first wave but approximately 2 times less than the third wave.
Thus, the infection rate during the third wave peaked at about five times the peak of the first wave.
Duration of each wave
The first wave lasted for about 190 days or 6.5 months. The second wave was slightly shorter, at 5.5 months or 160 days. The first wave peak to the second wave peak lasted approximately 190 days, again, with cases first declining to very low levels before beginning to rise again.
This period of extensive community transmission lasted about three months. From the peak of the second wave, the third wave peak took much less time of about 100 days, or 3.5 months, thus indicating that the third wave followed on the heels of the second wave.
However, the period during which cases remained low after the second wave began to decline and lasted only about 50 days. The in-between periods were crucial in determining the trajectory of the next wave.
“All the countries who were able to control the rate of infection used this time frame to retard the infection rate. Vaccination, regular sanitization, partial lockdown at that time could be helpful.”
Population vs. duration of each wave
In the nine countries where the second wave appeared to be over at the time of this study, the researchers arranged them by population into high- and low-population groups, using 50 million as the cut-off between them.
In the high-population group, the first wave took longer to subside, while it went down faster in the low-population group.
In Ukraine, for example, which has a population of 43.5 million, and with the second wave already over, the model predicted the total number of infected individuals at two million, with an error of less than 2%. When this same model was applied to Panama, the researchers estimate the total number of cases in the second wave to be 360,000, which is also close to the actual number of infections.
The Indian scenario
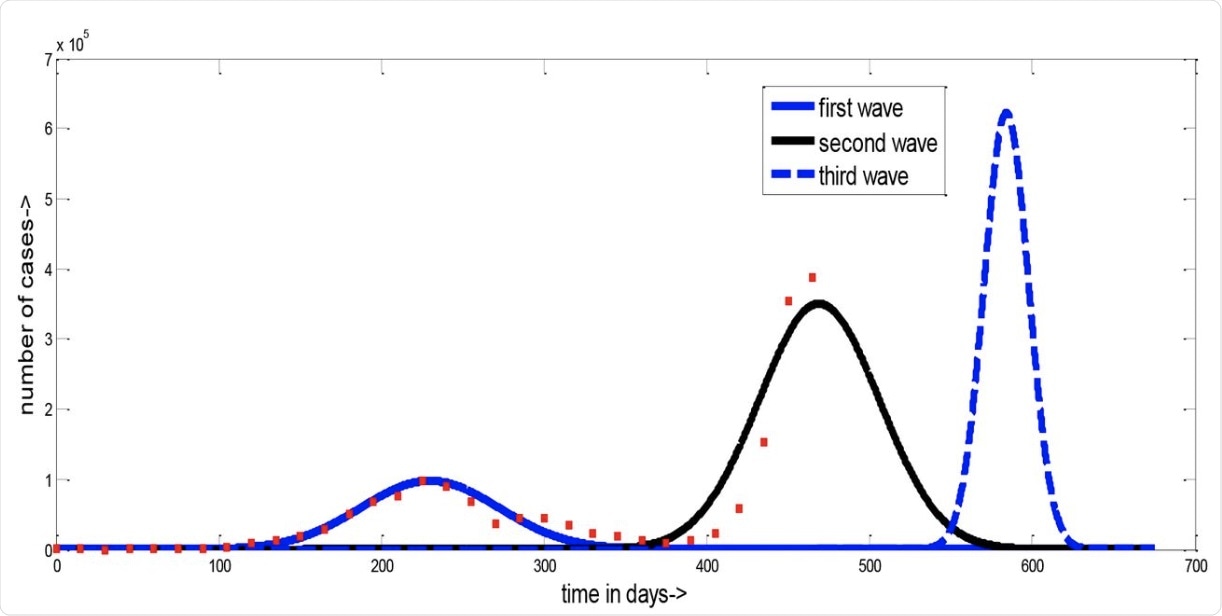
In India, which has a massive population of almost 1.37 billion, the first wave peaked in September 2020, while the second wave has been continuing to cause devastation since the beginning of April 2021. Using their formula, the researchers estimated that the highest single-day case peak during the second wave would be 350,000 on May 14, 2021, from a starting number of 8,600 on February 1, 2021.
In turn, the highest single-day case total for the third wave is predicted to be 622,000 on September 5, 2021. Altogether, the number of infected people after three waves was estimated to be approximately 63 million.
 This is the figure of actual COVID-19 situation and our predicted situation of India. The number of days from starting of the pandemic is plotted along x axis and the number of cases along y axis. The red dots represent the actual cases and lines represent our prediction.
Implications
The investigators urge timely action by the government of India to prepare for the third wave.
Taking into account the predicted peak of the third wave in early September 2021, the investigators counseled vaccination coverage of at least 60-70% of the population. The authors of the current study also advised a lockdown for at least one month during the period when the second wave is about to end.
The combination of these measures would reduce the magnitude by approximately half. The ability to reduce the extent of this wave would be sorely needed in view of the predicted steep curve of the third wave, which leaves less time to get it under control once it begins.
Other measures include strengthening the healthcare system in terms of beds, intensive care facilities, oxygen and other essential drugs and medical goods, personal protective equipment (PPE), and staffing. The pace of vaccination must pick up considerably, as must the number of tests.
Non-pharmaceutical interventions must be followed more strictly, without in-person social, political, or religious gatherings being permitted under any pretext whatever.
Of the second wave, the scientists say, “The daily number of infected cases has already crossed our prediction.” Accordingly, the possibility that 65 million people may eventually be infected after the third wave is a frightening one. Even more so is the fact that the official figures on which the study is based are almost certainly massive undercounts.
Ultimately, the authors point to the successful management of the pandemic in Australia, South America, and New Zealand as a pattern for India to follow.

 *Important notice: medRxiv publishes preliminary scientific reports that are not peer-reviewed and, therefore, should not be regarded as conclusive, guide clinical practice/health-related behavior, or treated as established information.