The severe acute respiratory syndrome coronavirus 2 (SARS-CoV-2) is one of many viruses that evolve quickly to increase transmission and overall survival as witnessed with the variants of concern such as Alpha, Beta, Delta, and now Omicron.
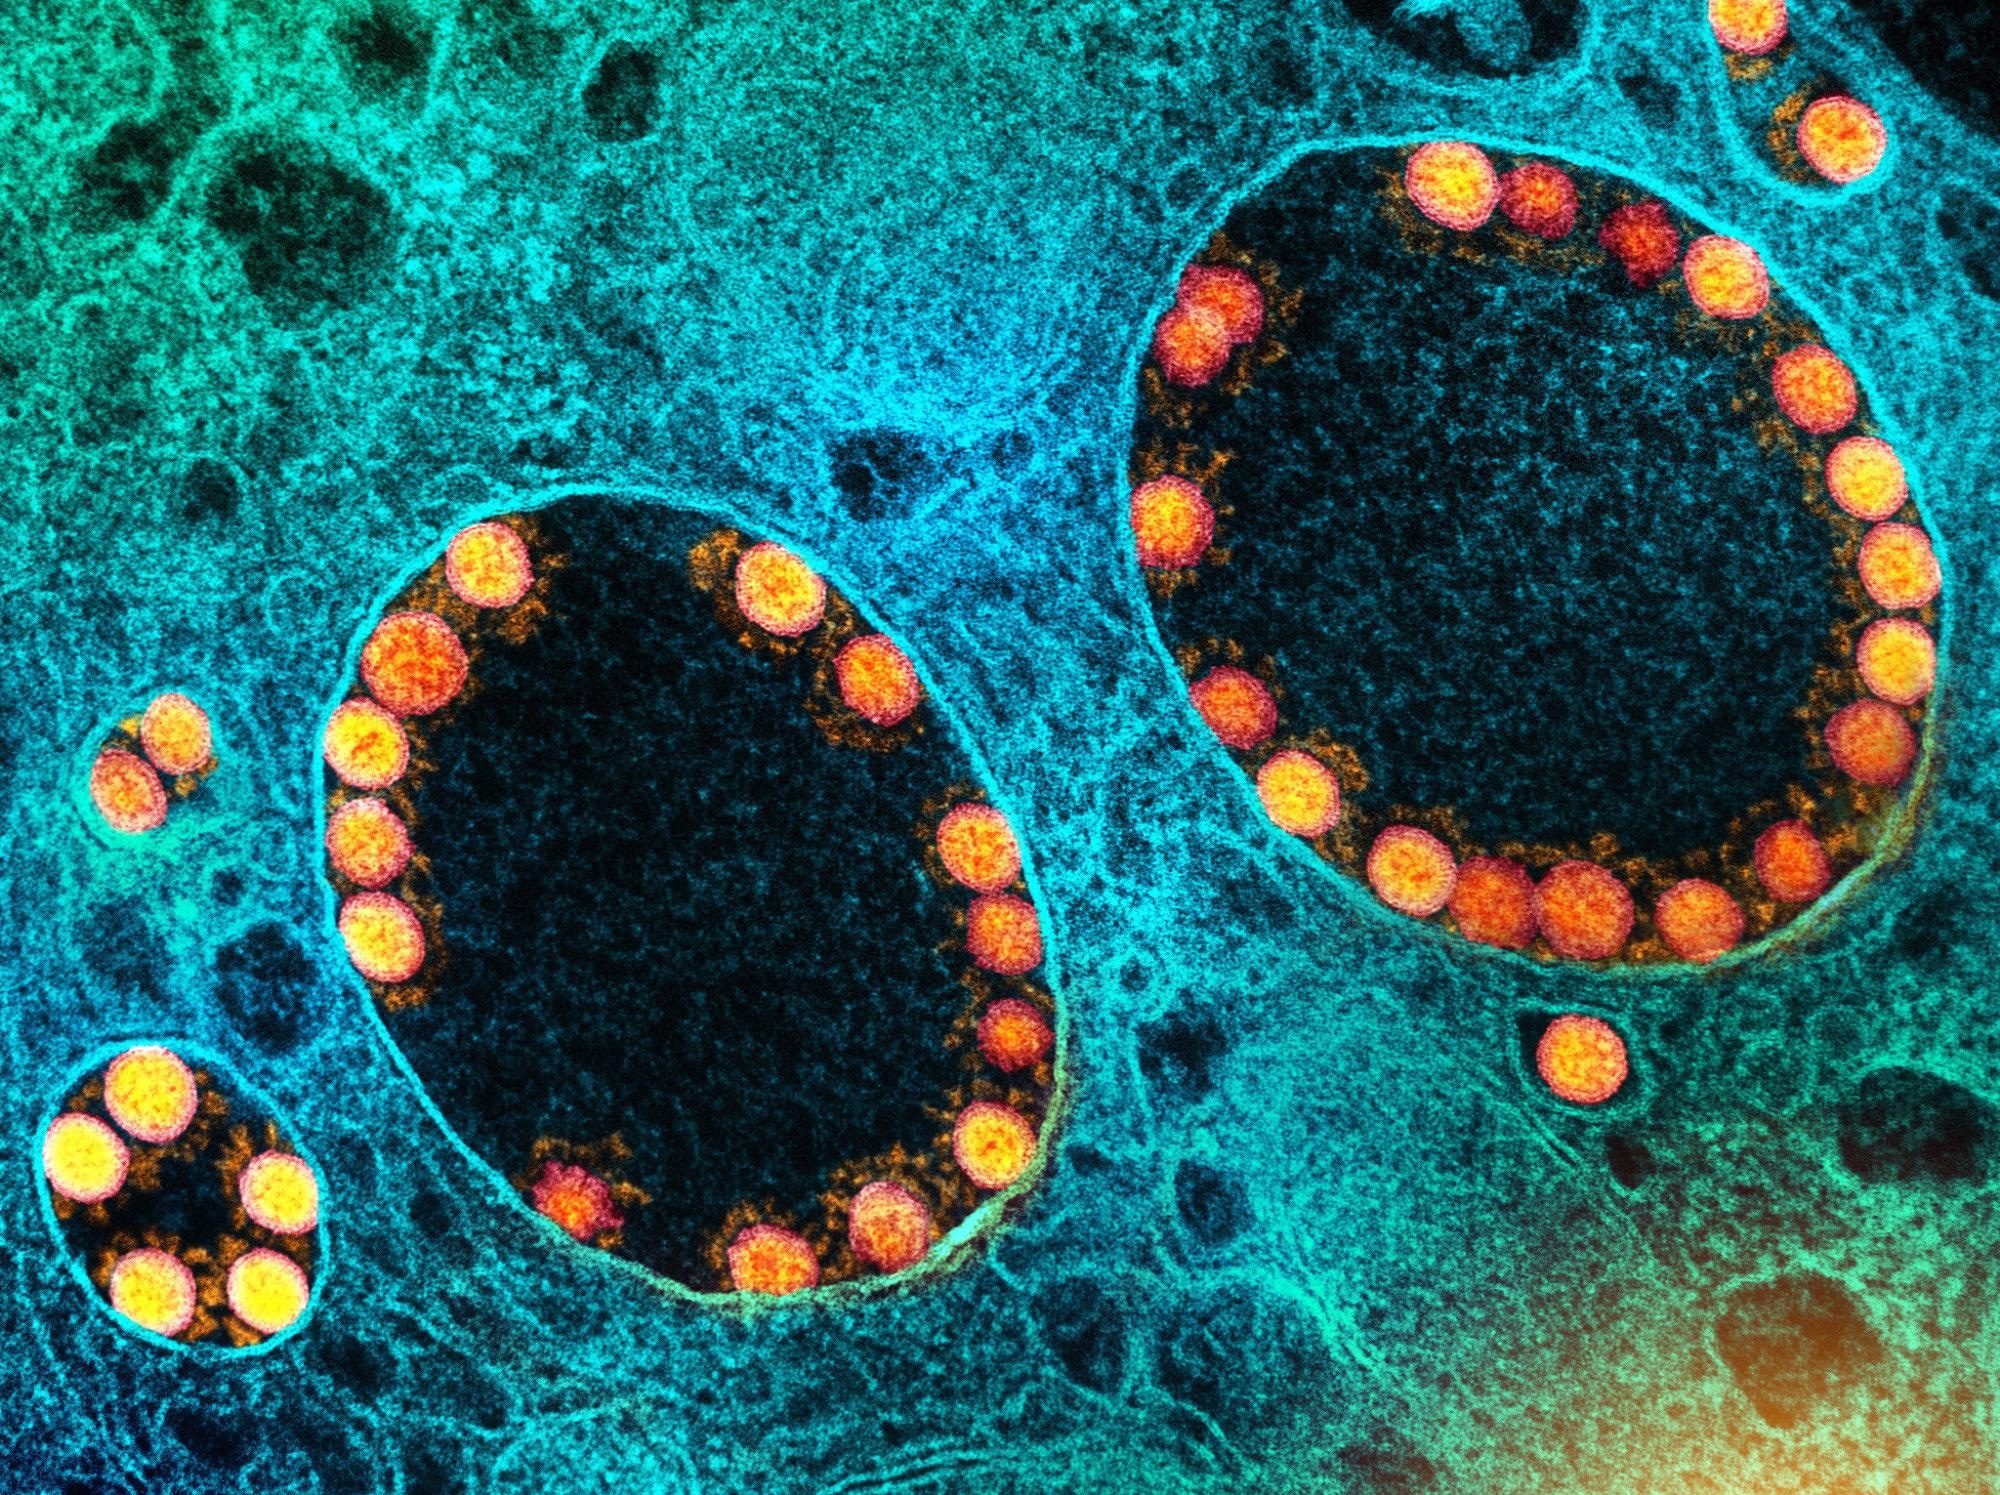
 Study: Modeling the dynamics of within-host viral infection and evolution predicts quasispecies distributions and phase boundaries separating distinct classes of infections. Image Credit: NIAID

 *Important notice: bioRxiv publishes preliminary scientific reports that are not peer-reviewed and, therefore, should not be regarded as conclusive, guide clinical practice/health-related behavior, or treated as established information.
Their findings suggest viral binding to host cells depends on the strength of the host’s immune system. Additionally, the researchers categorized infections into three different replicative strategies: acute, chronic, and opportunistic, which are similar to the behaviors of other viruses, including the flu virus, hepatitis, and SARS-CoV-2.
Increasing immunity could help resolve acute and opportunistic infections. However, viruses that cause chronic infections may be harder to eliminate because they develop mutations to evade the immune response.
Study details
mRNA viruses rapidly mutate and form clusters of closely related mutants known as quasispecies. Quasispecies have been observed in differential viral infections, including HIV.
The results found three main classes of viral quasispecies in a single infected host. Although the number of viral quasispecies may differ depending on a host’s immunity and how easily viruses enter host cells. The findings also showed that the three classes of quasispecies behave through three distinct phase transitions — from smooth to continuous to infinite order.
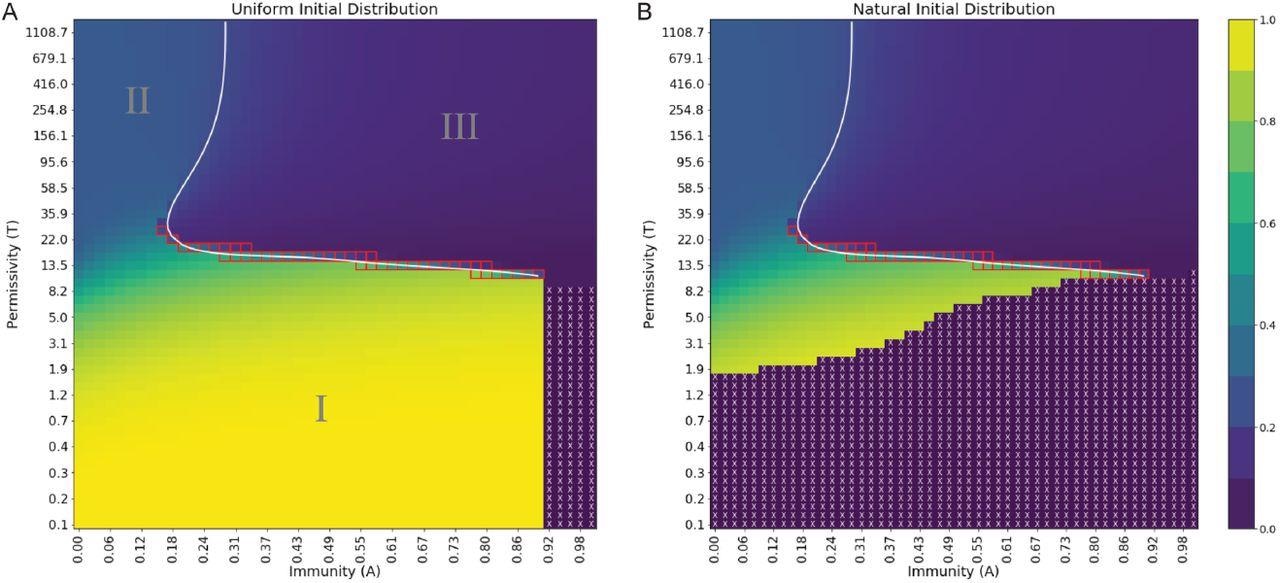
In phase I, high immunity and a low ability to successfully infect cells lead to steady-state quasispecies. In extreme situations, having this scenario could restrict infectivity and may lead to viral extinction. In phase II, with a high ability to infect cells and low immunity, viruses are directed towards a steady-state by entropy by increasing the number of mutations. Finally, phase III involves driving highly infectious viruses with moderate to high immunity to a steady state where they are able to evade the immune system.
Modeling simulations suggest it can take tens of thousands of iterations for viruses near the phase transition to level out after an infection. In other words, viral evolution plateaued for an extended amount of time near its final state before slowly and abruptly converging to the final state.

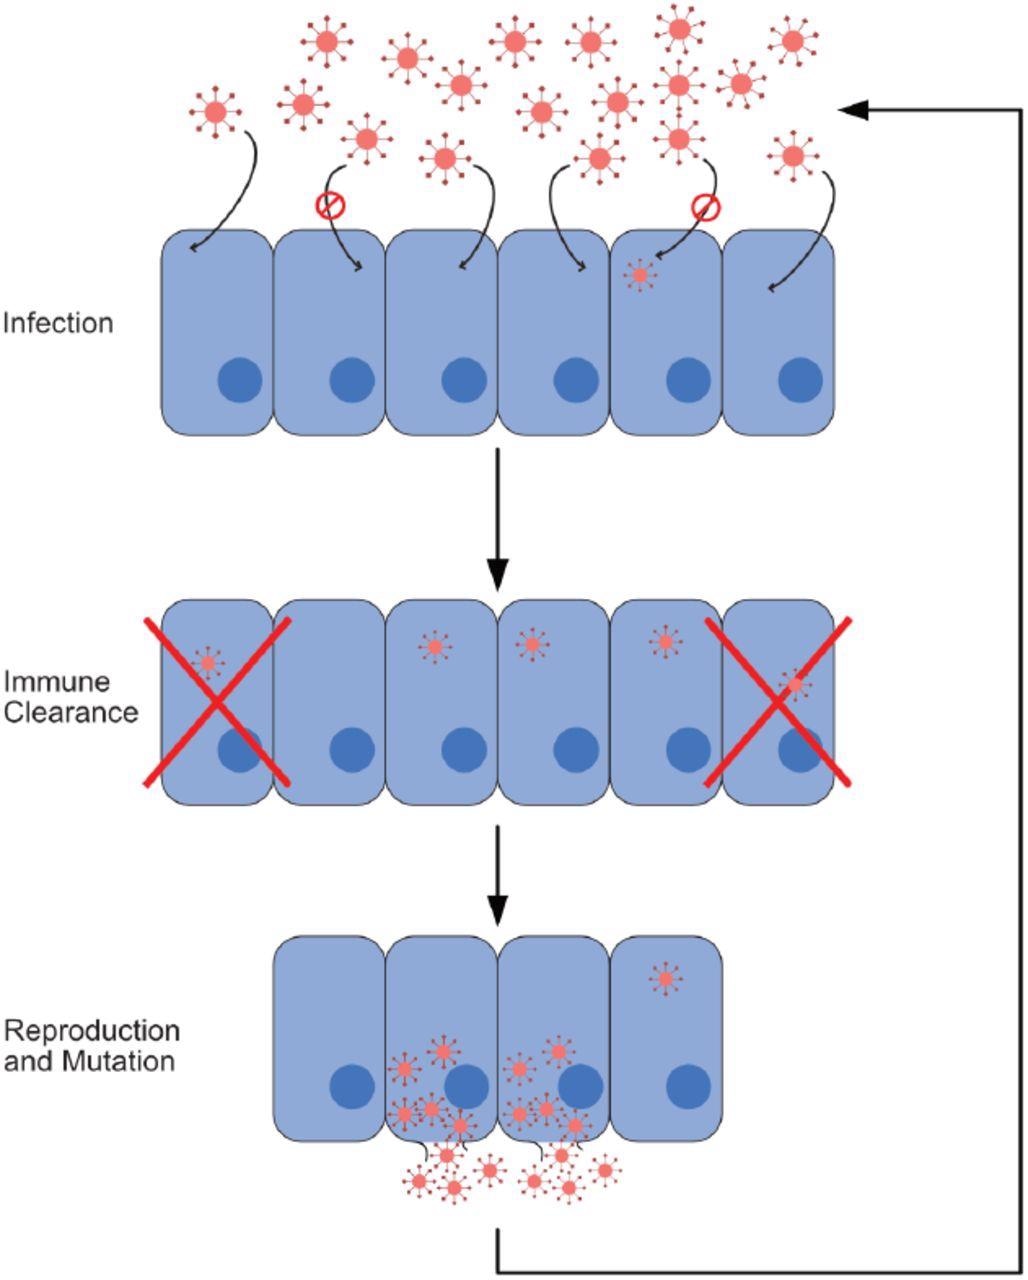
Infection process. In this figure, we show the cycle composing a single iteration of our model. This cycle consists of three steps: infection, immune response, and reproduction with mutation. Viruses that reproduce and mutate from the last step form the cohort infecting cells at the beginning of the next iteration. In our model, one iteration corresponds to a single time step.
Viruses appear to cause infection on a spectrum ranging from chronic, acute to opportunistic viral infections. Viruses below phase I correspond to “acute” viral infections similar to those seen in the flu viruses, rhinoviruses and previous coronavirus strains.
The model also predicted that viruses with broad immunity, such as those in phase III are linked to chronic infections where they are able to evade the immune response insistently. Resolving chronic infections may involve increasing the difficulty for viruses to infect cells.

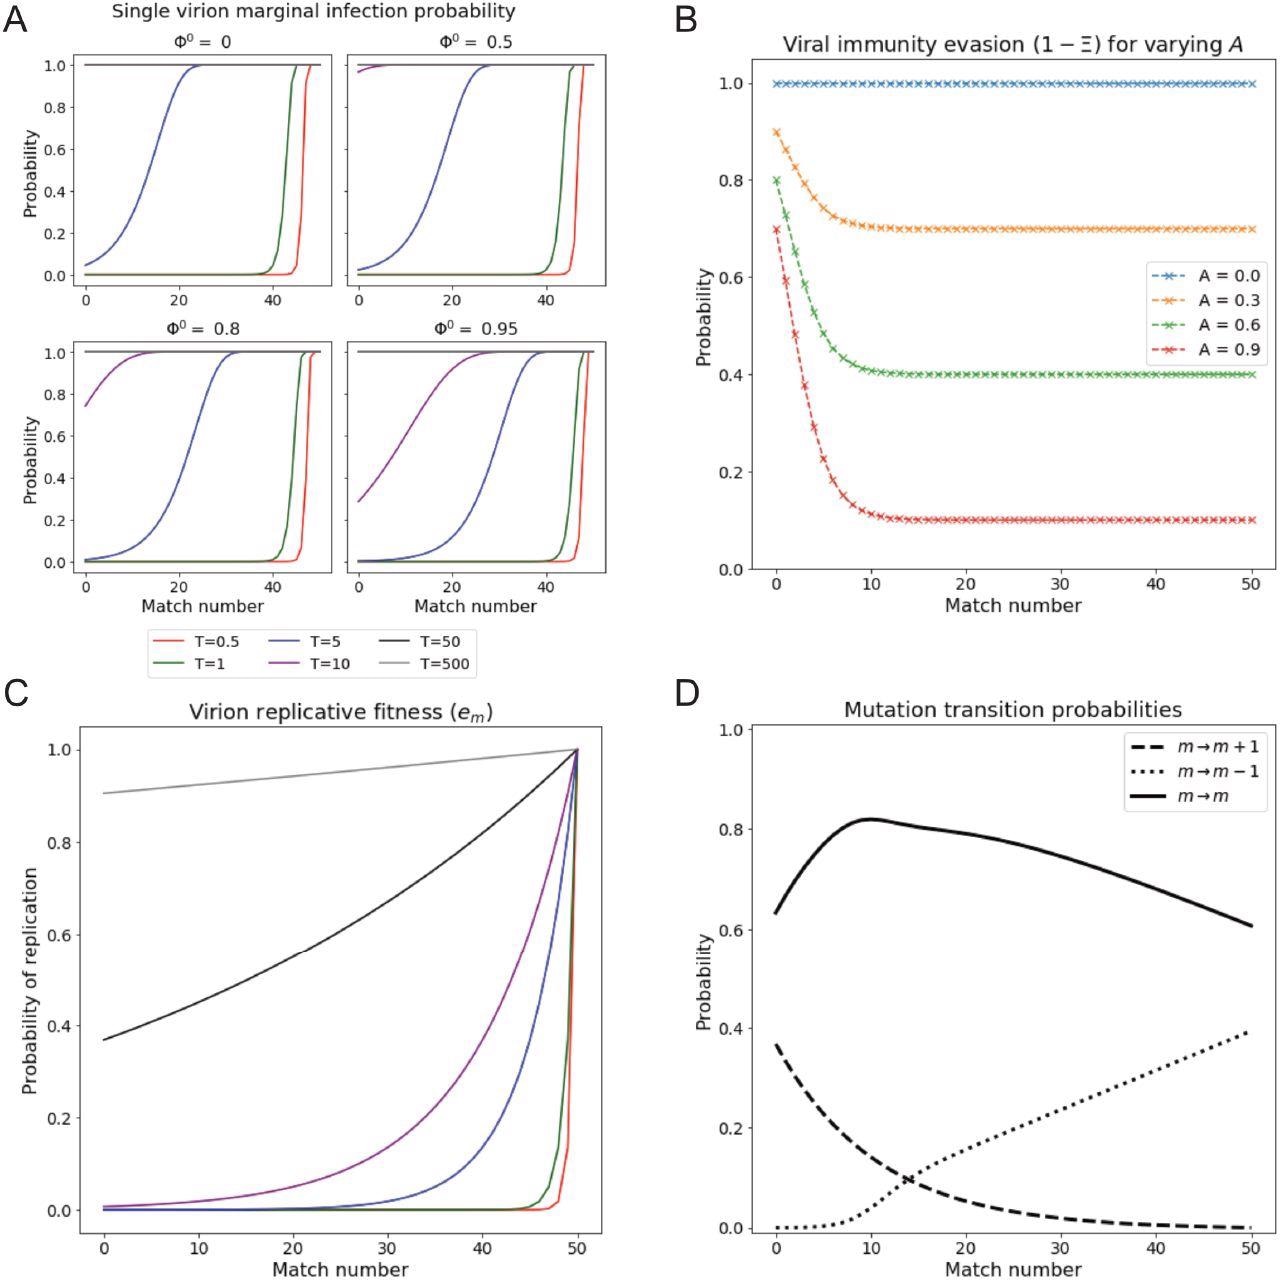
Single virion reproductive fitness and infection probability vary with match number and permissivity. (A) Infection probability of a single virus of match m, under conditions of various prior cell fillings Φ0 and for varying permissivity T. Higher occupancy results in notable decreases in infection probability especially for lower m. Note that infection probabilities, unlike em (Panel C), exhibit a shoulder at high m. (B) Probability of virus to survive immune response as a function of match m, for various immunity levels A. Immune response saturates with increasing m above around m = 14, where the level is 1 − A. (C) Replicative fitness (probability of replication) as a function of match number for varying T. Legend shared with Panel A. (D) Replication-associated mutation probability as a function of m. Note that the probabilities of increasing and decreasing m via mutation are equal at m = 14, giving the mode of the Natural initial distribution.
Viruses classified as phase II have an abundance of mutations and correspond with opportunistic viral infections that are more likely to present in immunosuppressed or immunocompromised individuals.
The researchers suggest viruses that cause chronic infections are more difficult to eliminate — even when the immune system is boosted. Conversely, having some immunity plays a huge role in decreasing the viral load for opportunistic cases. In addition, the team predicts the level of immunity one has in an acute phase of infection dictates the rate of recovery “as evidenced by the corresponding decrease in time to steady-state and increase in extinction probability.”

Order parameter at steady state exhibits distinct regions of behavior and extinction, separated by phase boundaries of varying order. (A) Uniform initial distribution. (B) Natural initial distribution. Order parameter values are depicted in a continuous range of colors from purple (0.0) to yellow (1.0). Purple regions with white X’s denote viral extinction before the end of simulations. The white line is a spline fit to locations of maximal difference in order parameter at fixed permissivity or immunity. Red squares denote points where Pm is bimodal. A reminder that the natural scale for permissivity is between T ≈ 1 and T ≈ 70, where most changes in behavior are expected to occur.
Future Directions
The researchers believe the current model helps map the complex interactions between viral evolution and mechanisms behind infectivity. However, they note several areas for improvement in the future.
The first is maintaining secondary parameters constant, including the mutation rate and the rate of replication, to better observe the effects of individual parameters across different phases. Another proposal is to introduce an immune module to simulate the adaptive immune response better. The current model has a static memory, but the human adaptive immune system stores the memory of viral pathogens away to better recognize new threats and create a timelier response.

 *Important notice: bioRxiv publishes preliminary scientific reports that are not peer-reviewed and, therefore, should not be regarded as conclusive, guide clinical practice/health-related behavior, or treated as established information.