Coronavirus disease 2019 (COVID-19) first arose in Wuhan, China, in late December 2019, before spreading rapidly across the rest of the world. In the first weeks following the detection of severe acute respiratory syndrome coronavirus 2 (SARS-CoV-2) outside mainland China, countries in Europe, rather than the nearby Asian nations, suffered from higher case numbers. This was partially due to the rapid and effective measures already in place to control pandemics in Asia, but also due to the differing demographics between the countries - Italy, with one of the oldest populations, showed massive spikes in cases early on.
Now, researchers from New Jersey City University have been attempting to explore the same factors to identify vulnerability in U.S. cities. Their research, under consideration at the journal Scientific Reports, is currently available on the Research Square* preprint server.
 Pandemic vulnerability index of US cities
The Study
A total of 41 variables related to demographics, social and economic features, the surroundings of the individuals, and the health of various areas were studied with variable weights derived with the F-Classification (F.C.) feature selection algorithm as to the extent of their ability to indicate the prevalence of COVID-19 infections in U.S. cities. Five vulnerability dimensions with scores in close range (0.17-0.22) were chosen. Demographics were identified as the most influential dimension for the spread of COVID-19 at 0.22, with mobility & connectivity and health & environment both close behind with 0.21 each, followed immediately by socioeconomic factors (0.19) and urban form & density at 0.17.
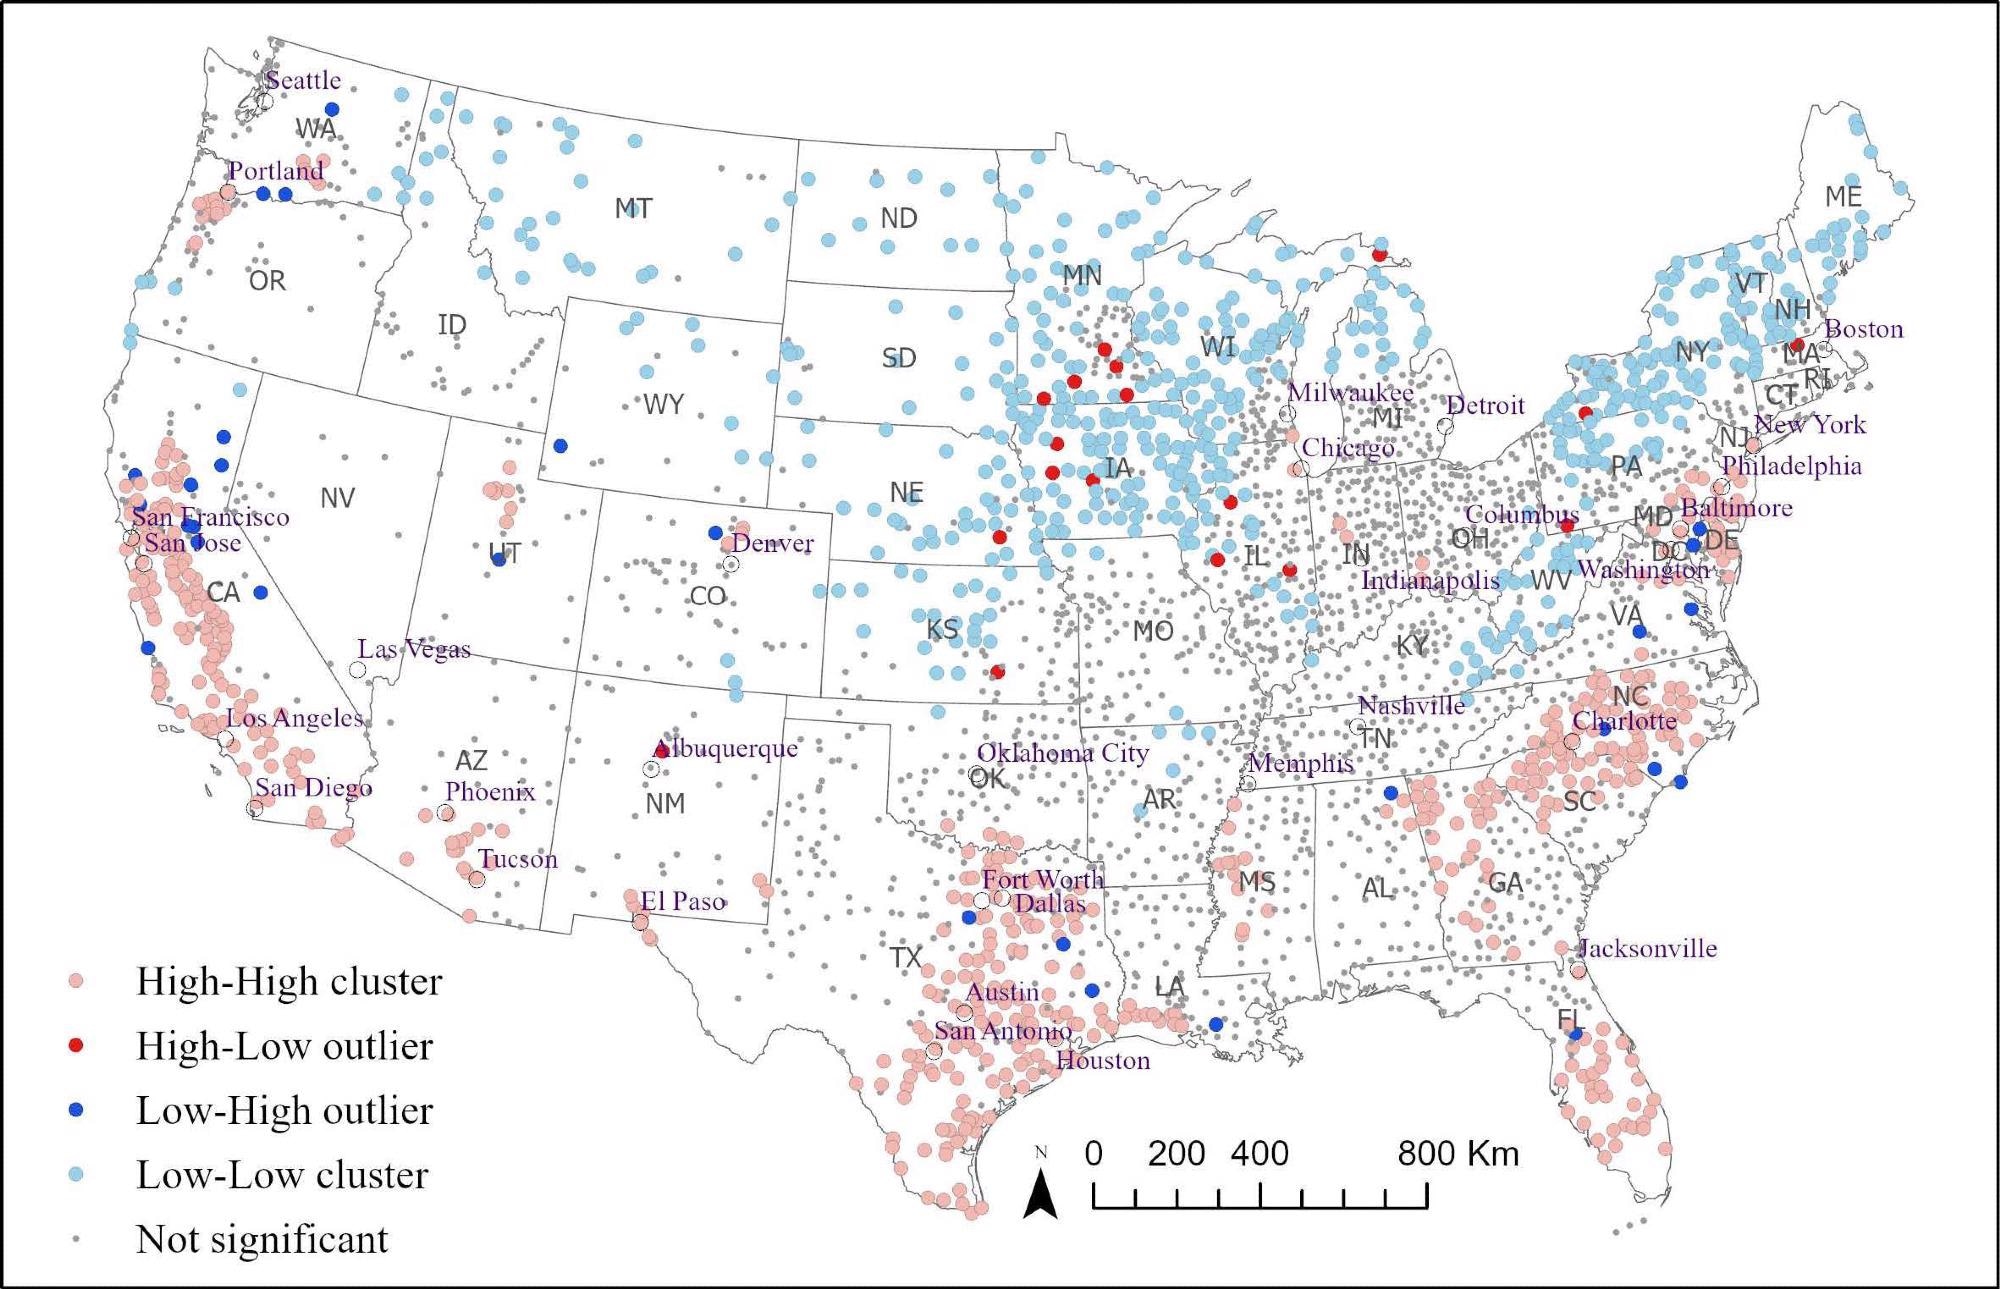
 Vulnerability clusters and outliers of 3,069 US cities
The most important subfactors within these variables had substantial effects on COVID-19 transmission. Within the ten demographic variables, the size of the younger population was identified as the most crucial factor for COVID-19 transmission. This was likely due to greater social mobility, exacerbated by a lack of COVID-19 safety protocols and a lower likelihood of receiving the vaccine. The other variables mostly followed expected patterns, with variables indicating higher population density or greater mobility increasing the likelihood of higher transmission rates.
This pattern continued when examining the socioeconomic variables, with the highest weight variable shown to be congested living, at 0.17. This was followed by education level, per capita and median income and low-wage population, all of which are highly linked. Educated people are more likely to be health-conscious, while higher-income helps individuals avoid crowded places by moving engagements online. Working population, income inequality, mobile housing, and the unemployment rate were all shown to have weak or no influence on the number of COVID-19 cases. When examining the individual variables within each of the five vulnerability dimensions, the most influential by far was the uninsured population, at 0.28, followed closely by air quality and distance to the nearest metropolitan city.
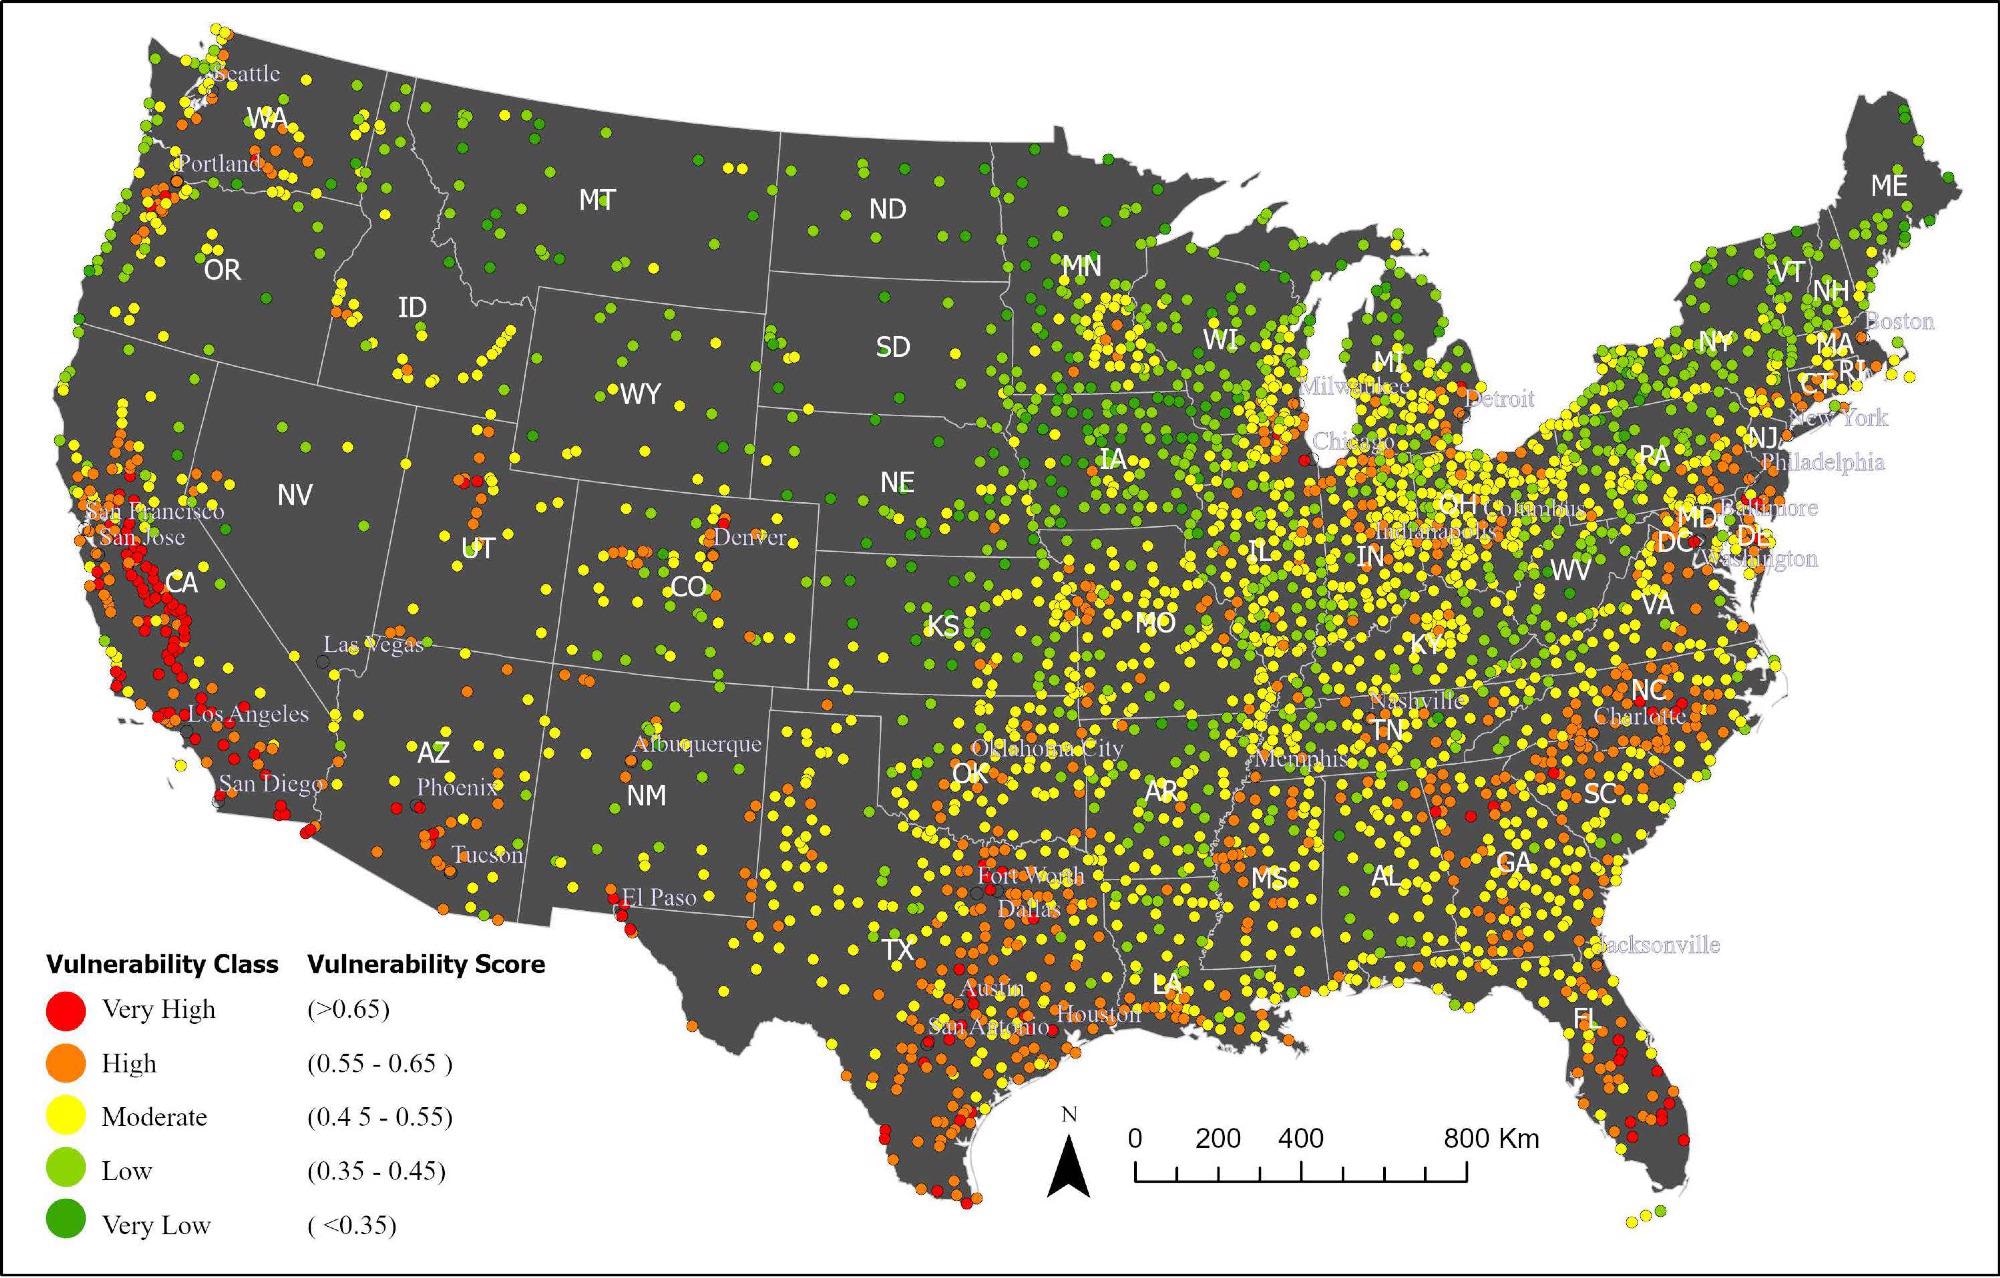
Following this, the researchers investigated the pandemic vulnerability index at the city level (PVI-Cl), as this was found to provide the best fit. PVI-Cl scores were categorized in five classes, with cities classified as very high, high, moderate, or low vulnerability. The vast majority (1,390) of cities were found to be at moderate vulnerability, but 29% were at high or very levels of vulnerability. Generally, cities in California, Oregon, Arizona, Texas, Florida, and North Carolina showed some of the highest levels of vulnerability, while cities in the Rockies were at the lower end.
Mapping out the calculated PVI-Cl scores helps demonstrate many patterns. As one would expect, isolated cities in the North West/Midlands tended to be categorized as low or very low vulnerability. California stands out as a hotspot of 'very high cities,' as do Texas and Florida. The highly populated east features a sea of moderate and low cities, with several clusters of high vulnerability areas. Following local analysis of spatial autocorrelation using Local Moran's I on PVI-Cl scores, the researchers revealed that 35% of cities were clustered within a geographic grouping of similarly extreme vulnerability at the 95% confidence level, with the geography of higher vulnerability showing distinctive patterns of five large clusters of higher vulnerability in areas of greater population density.
Conclusions
The authors' analyses help identify some of the most and least at-risk cities in the U.S. and factor in a broad range of variables that could help local governments identify where their local issues might arise from. It also uses a multi-method approach to generate more profound insights into the variation of weights of the variables, demonstrating the critical factors of pandemic vulnerability as well as evaluating case and mortality rates. The research could help inform future public health policy, especially in cities with the highest vulnerability ratings.
Journal reference:
- Md. Shahinoor Rahman, Kamal Chandra Paul, Md. Mokhlesur Rahman et al. Pandemic Vulnerability Index of U.S. Cities: A Hybrid Knowledge-based and Data-driven Approach, 24 March 2022, PREPRINT (Version 1) available at Research Square, https://www.researchsquare.com/article/rs-1417025/v1