Vaccination is essential to curtail transmission of SARS-CoV-2 and for mitigating COVID-19 severity. To date, a handful of SARS-CoV-2 vaccines are either in the early use phase or have received approval for administration to the general population. However, the protection conferred by vaccines is challenged by the emergence of novel genetic variants.
 Study: Rapid evaluation of COVID-19 vaccine effectiveness against symptomatic infection with SARS-CoV-2 variants by analysis of genetic distance. Image Credit: Foxeel / Shutterstock
About the study
In the present study, researchers performed GD analysis to evaluate the VE of COVID-19 vaccines against symptomatic SARS-CoV-2 infections based on data from population-based epidemiological studies.
The four vaccine platforms evaluated were the messenger ribonucleic acid (mRNA)-based vaccines, protein subunit vaccines, viral vector-based vaccines, and inactivated vaccines, which were received by 39, five, 24, and 10 individuals, respectively. GDs were calculated based on the mean hamming distances on the receptor-binding domains (RBDs) of SARS-CoV-2 variants to the strains present in the vaccines.
VE was estimated by mixed-effects modeling in which GD was the key predictor and the confounders such as age and the time elapsed post the second vaccinations were controlled. VE and GD of the authorized vaccines were compared, and subsequently, the team explored the impact of GD on immune protection conferred by vaccines. The VE values were estimated against SARS-CoV-2 VOCs such as Alpha, Beta, Gamma, Delta, and Omicron (including the BA.1 subvariant, the BA.1.1 subvariant, the BA.2 subvariant, and the BA.3 subvariant), and VOIs such as Lambda and Mu.
Further, the VE-GD model was assessed by validation data. VE data from 57 studies and 23 studies (variant-specific VE) were used for model training and validation, respectively. Further, SARS-CoV-2 variants were predicted with their observed VE not known. The application of the estimated VE by the VE-GD model was assessed in real-time against the circulating SARS-CoV-2 variant in a specific geographical area, e.g., California.
Lastly, the team explored if region-wise vaccines could be developed and if they would match with the circulating SARS-CoV-2 strain profiles, for which strains from 13 regions viz. the United Kingdom (UK), South Africa, Germany, India, Russia, Malaysia, Hong Kong, California, Japan, New York, Peru, Brazil, and Mexico were analyzed.
Results
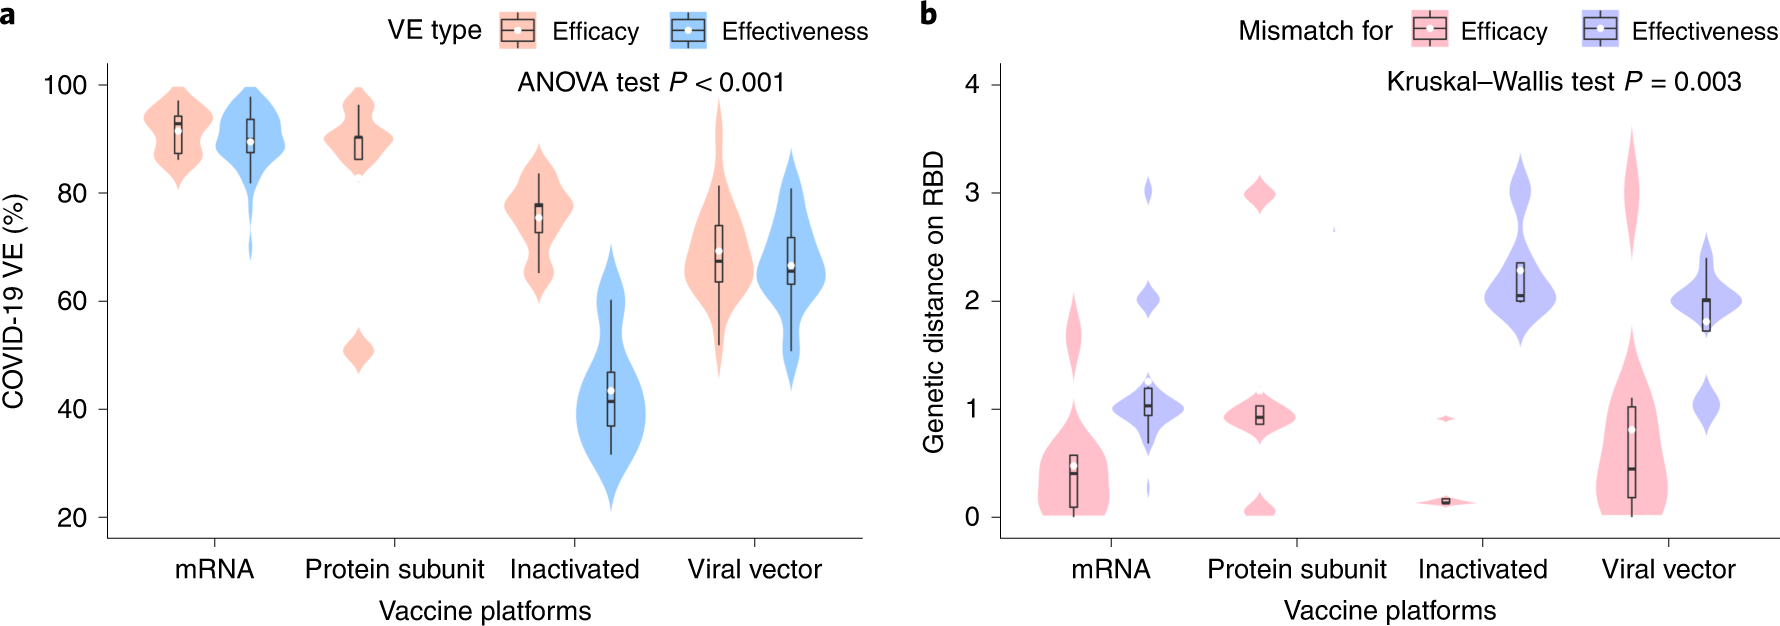
Among the vaccines assessed, VE estimates for the mRNA-based vaccines, protein subunit vaccines, viral vector-based vaccines, and inactivated vaccines were 90%, 83%, 69%, and 60%, respectively. Of interest, the GD of the vaccines exhibited an opposite trend, i.e., the least GD was observed for the mRNA-based vaccines, whereas the other three vaccines exhibited larger GD, and these differences could be due to the varying periods of vaccine evaluation. The mRNA-based vaccine trials were completed first during the period when the SARS-CoV-2 population had relatively higher homogeneity.
 a, Distribution of the VE estimates for different platforms. The VE of mRNA and protein subunit vaccines are higher than other vaccines (two-sided ANOVA test P = 2.2 × 10⁻¹⁴, n = 78). b, Distribution of genetic mismatch on RBD for different vaccine technologies. Genetic mismatch is the lowest for mRNA vaccines (two-sided Kruskal–Walls test P = 0.003, n = 78). In the box plots, the middle bar indicates the median; the white dot indicates the mean; and the boundaries are Q1 and Q3. Whiskers of the box plot are extended to Q3 + 1.5× interquartile range (IQR) and Q1 − 1.5× IQR.
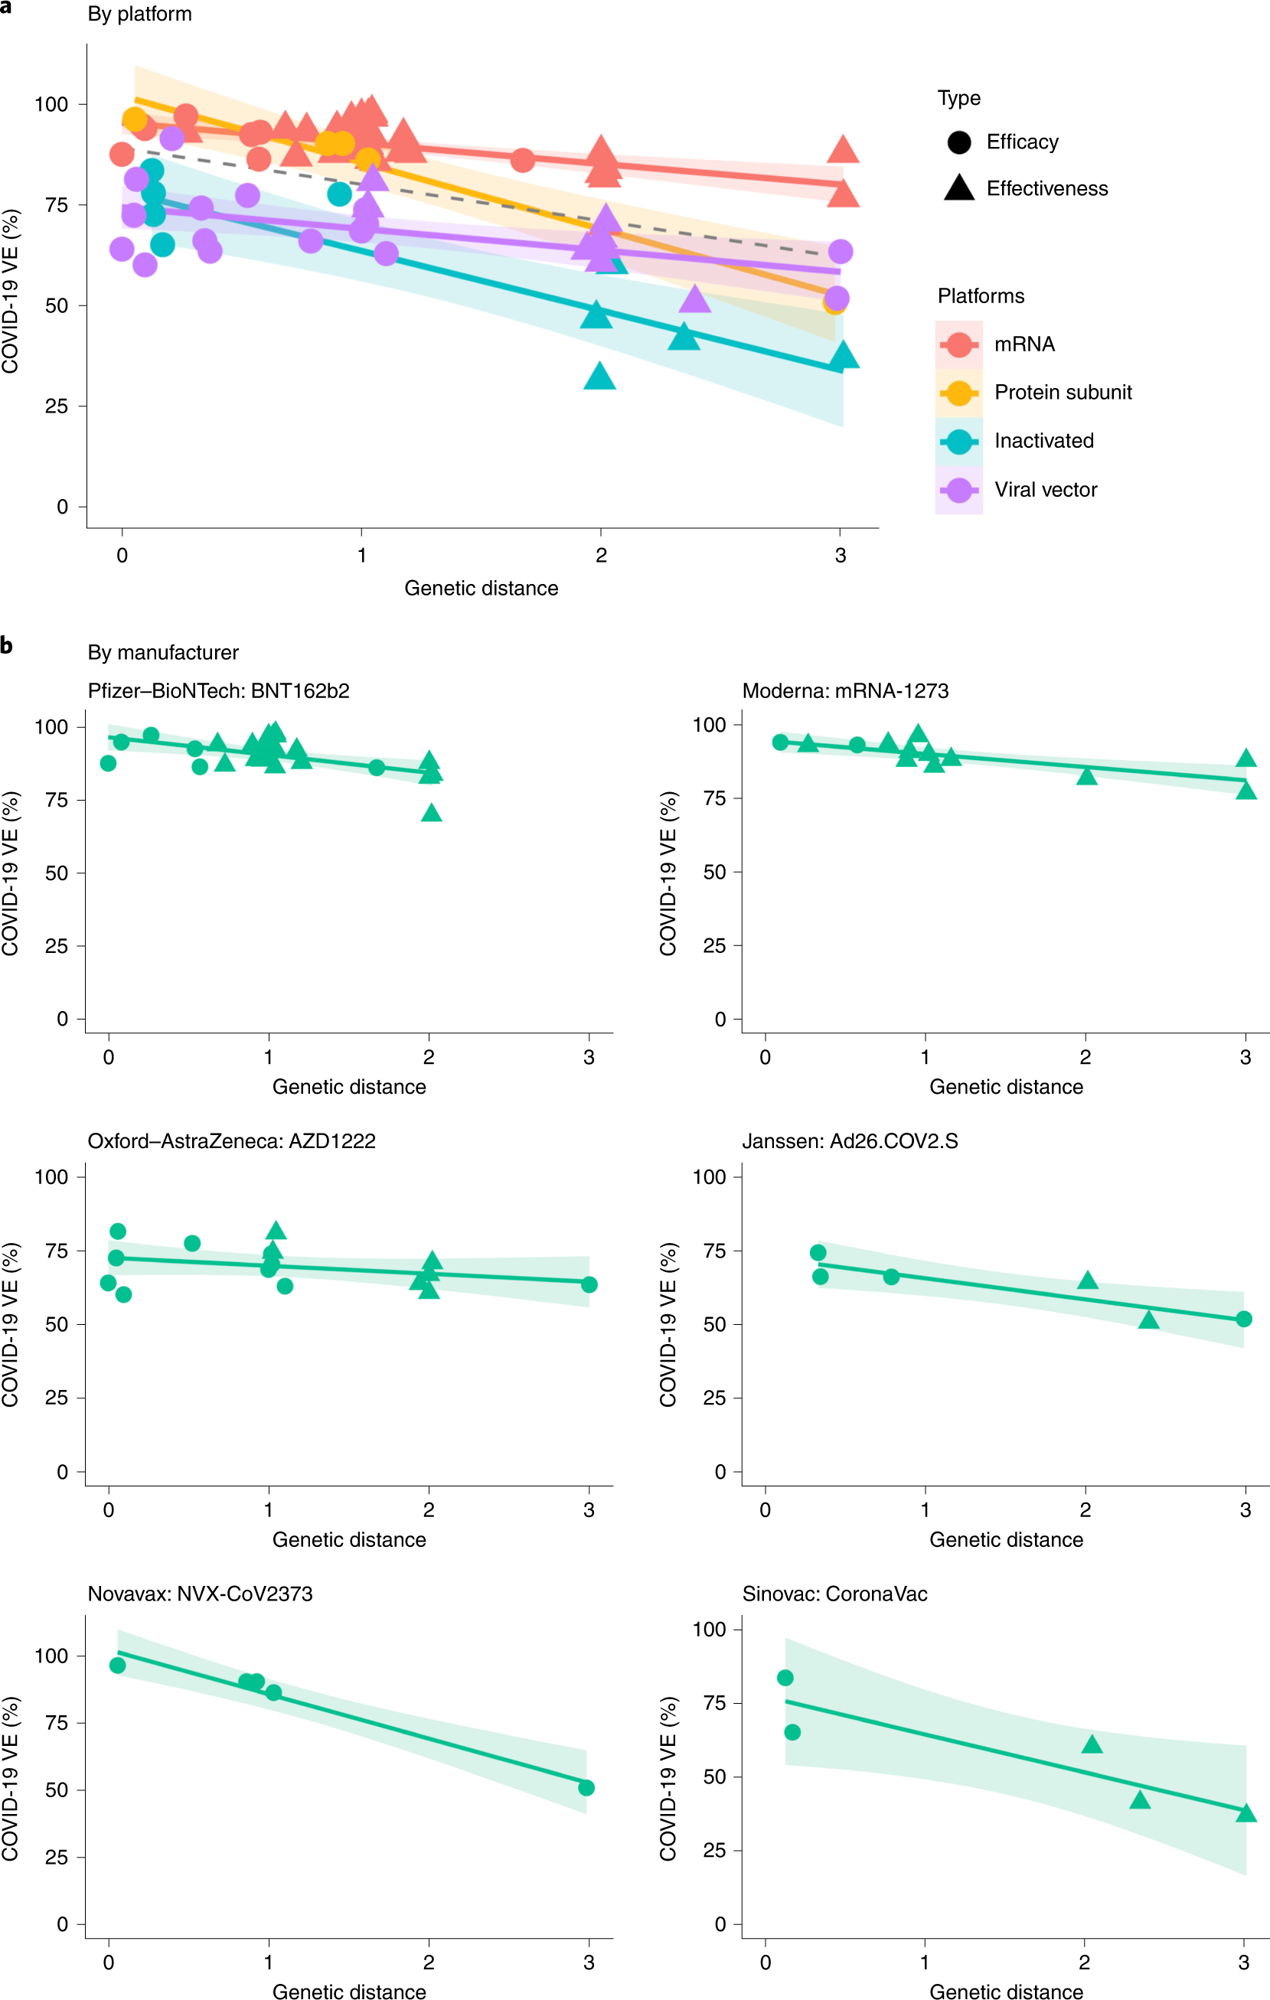
Over 86% and 88% of VE variations were explainable based on their GDs after the random effects of the vaccine technological platforms and those of the vaccine products (viz. mRNA-1273, BNT162b2, Ad26.COV2.S, AZD1222, CoronaVac and NVX-CoV2373), respectively were controlled. GD on the S RBD demonstrated the most profound impact on the protection conferred by vaccines, whereas no link was found between VE and GD of other SARS-CoV-2 proteins. With each S RBD substitution, VE would decrease by 5.2%, 6.8%, 14.3%, and 15.8% for the mRNA-based vaccines, viral vector-based vaccines, protein subunit vaccines, and inactivated vaccines, respectively.
The S protein and N-terminal domain (NTD) demonstrated weaker associations between VE and amino acid substitutions. In no GD was present, the VE (by the RBD area) for mRNA-based vaccines and protein subunit vaccines was estimated to be ~96%, whereas the VE for the viral vector-based vaccines and inactivated vaccines were estimated to be lesser by 20.6% and 17.3%, respectively.

a, Negative linear relationships between VE and GD for different vaccine platforms (P = 0.038, R2 = 86.3%). The dashed line was fitted by all data points. b, Negative linear relationship between VE and GD for each vaccine product (P = 0.006, R2 = 87.9%). The two-sided P value was obtained from the mixed-effects model. The colored lines were fitted by data points of each platform. The shaded area indicates 95% CI.
Predicted VE estimates of the mRNA-based vaccines and the viral vector-based vaccines for Delta were 82.8% and 61%, respectively, and the corresponding observed VE values were 83% and 67% for the BNT162b2 mRNA-based vaccine and the AZD1222 l vector-based vaccines, respectively. Likewise, predicted VE estimates for the BNT162b2 and mRNA-1273 vaccines were 89.4% against Alpha and 73.7% against Beta and Gamma, similar to the corresponding observed VE values of 86% and 77%, respectively.
The predicted VE for the mRNA-1273 vaccine against Omicron was 14%, similar to the observed VE of 13.9% in December 2021 in California. The findings were indicative of the increased validity of the VE-GD approach. Predicted VE estimates for mRNA-based vaccines against the Omicron subvariants were between 11.9 % (Omicron BA.1) and 33.3% (Omicron BA.2).
The model predicted that VE estimates for VOCs other than Omicron and VOIs such as Mu and Lambda would be >50% after three months of double mRNA-based vaccination; however, the VE estimates for inactivated vaccines against SARS-CoV-2 infections (symptomatic) were estimated to decrease with the emergence of novel genetic variants of SARS-CoV-2.
The Omicron subvariants could be matched to all regions investigated except Russia in the period between January 2022 and February 2022; however, different subvariants were predominant in different geographical regions. The findings indicated that updating vaccine formulations with only one variant may be inadequate for matching the viral populations present across the globe.
Conclusion
Overall, the study findings highlighted the link between genetic mismatch of circulating SARS-CoV-2 variants and reported COVID-19 VE based on the integration of epidemiological studies and GD analysis of SARS-CoV-2 variants. Furthermore, the findings indicated that GD values could substantially explain VE alterations against SARS-CoV-2 variants, and VE assessments against evolving pathogens could aid in the development of vaccines.