Viral emergence, transmission, and diversity can impact control efforts and outbreak dynamics. The use of genome sequencing has transitioned over the past decades from retrospective to near-real-time investigations. As evidenced during the coronavirus disease 2019 (COVID-19) pandemic, sequencing-assisted variant characterization can inform public health practice, improve disease forecasting, and aid the development of therapeutics, diagnostic assays, and vaccines.
Understanding variant characteristics complemented with accurate estimates of the variant’s regional prevalence can help implement and evaluate public health strategies to contain transmission. However, limited data and heterogeneous sequencing/diagnostic capacity across countries constrain the modeling of complex dynamics.
 Study: Early risk-assessment of pathogen genomic variants emergence. Image Credit: NIAID

 *Important notice: medRxiv publishes preliminary scientific reports that are not peer-reviewed and, therefore, should not be regarded as conclusive, guide clinical practice/health-related behavior, or treated as established information.
The study and findings
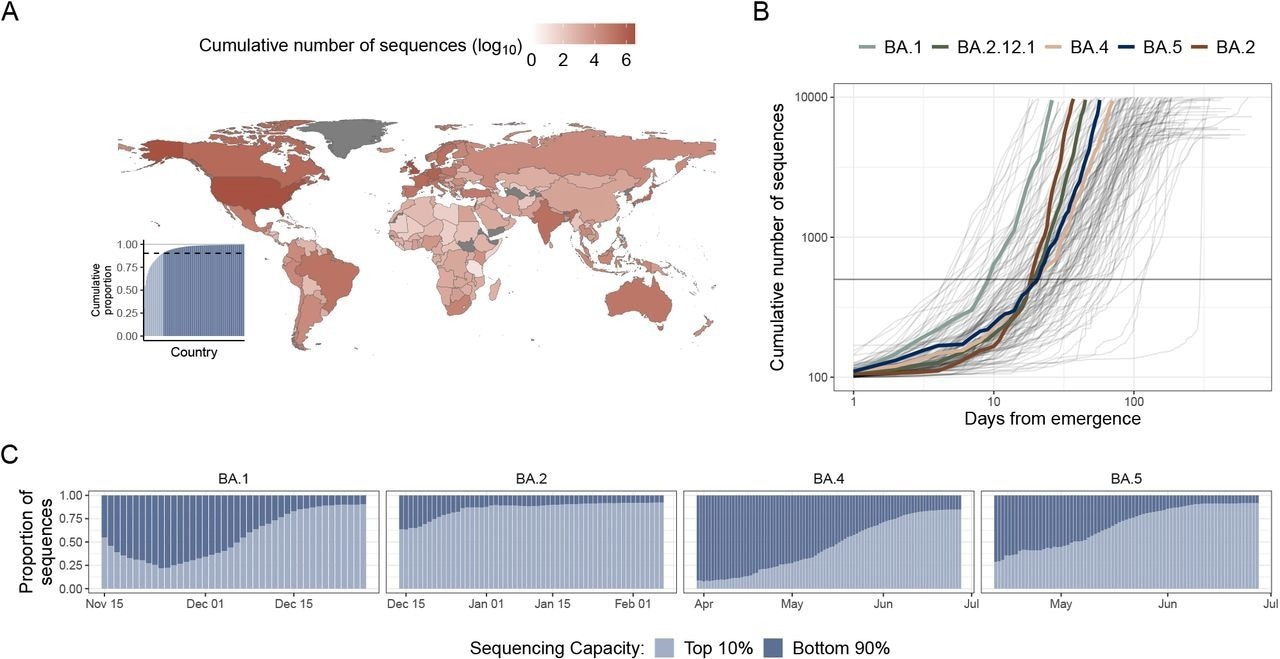
The present study reported a hierarchical modeling method that estimates variants’ growth trajectories over time. Most SARS-CoV-2 sequences were from the United States (US) and the United Kingdom (UK), contributing nearly 55% of all sequences available in the Global Initiative on Sharing Avian Influenza Data (GISAID) repository as on July 1, 2022.
Approximately 90.3% of all SARS-CoV-2 sequences were submitted to GISAID by 10% of countries. Contrastingly, countries in the Middle East and Africa submitted a few thousand sequences exempting Kenya and South Africa. The rate of sequencing for emergent variants accelerated over time.
 The landscape of SARS-CoV-2 genomic data and early emergent variant dynamics. (A) Shading indicates the cumulative number, in log10 scale, of SARS-CoV-2 sequences submitted to GISAID as of July 1st, 2022. (inset) Cumulative proportion of all sequences, with countries ordered by their relative contribution. Light blue indicates countries in the top 10th percentile of contributions, and dark blue indicates countries in the bottom 90th percentile of countries. (B) The cumulative number of sequences versus days from variant emergence, with variants of interest which grew rapidly after emergence highlighted in color. A gray horizontal line at 500 sequences is included to highlight the time it took to reach this level for the key variants. (C) The proportion of sequences sampled by the high sequencing capacity countries (light blue) vs. the lower sequencing capacity countries (dark blue) over time, starting from after a variant’s emergence.
Initially, the number of sequences of a variant grew slowly and linearly when its prevalence was low. Then, as the variant increased in circulation, there was an exponential surge in its sequences. Shortly after emergence, most SARS-CoV-2 Omicron BA.1, BA.2, or BA.5 lineage sequences were from outside the high-capacity nations.
Nonetheless, once the variants were detected in countries with high-sequencing capacity, sequences were rapidly collected, becoming the majority. The researchers designed a general method to examine the dynamics of competing variants and relative variant fitness advantages by pooling data from across countries and applied this to emergent SARS-CoV-2 variants.
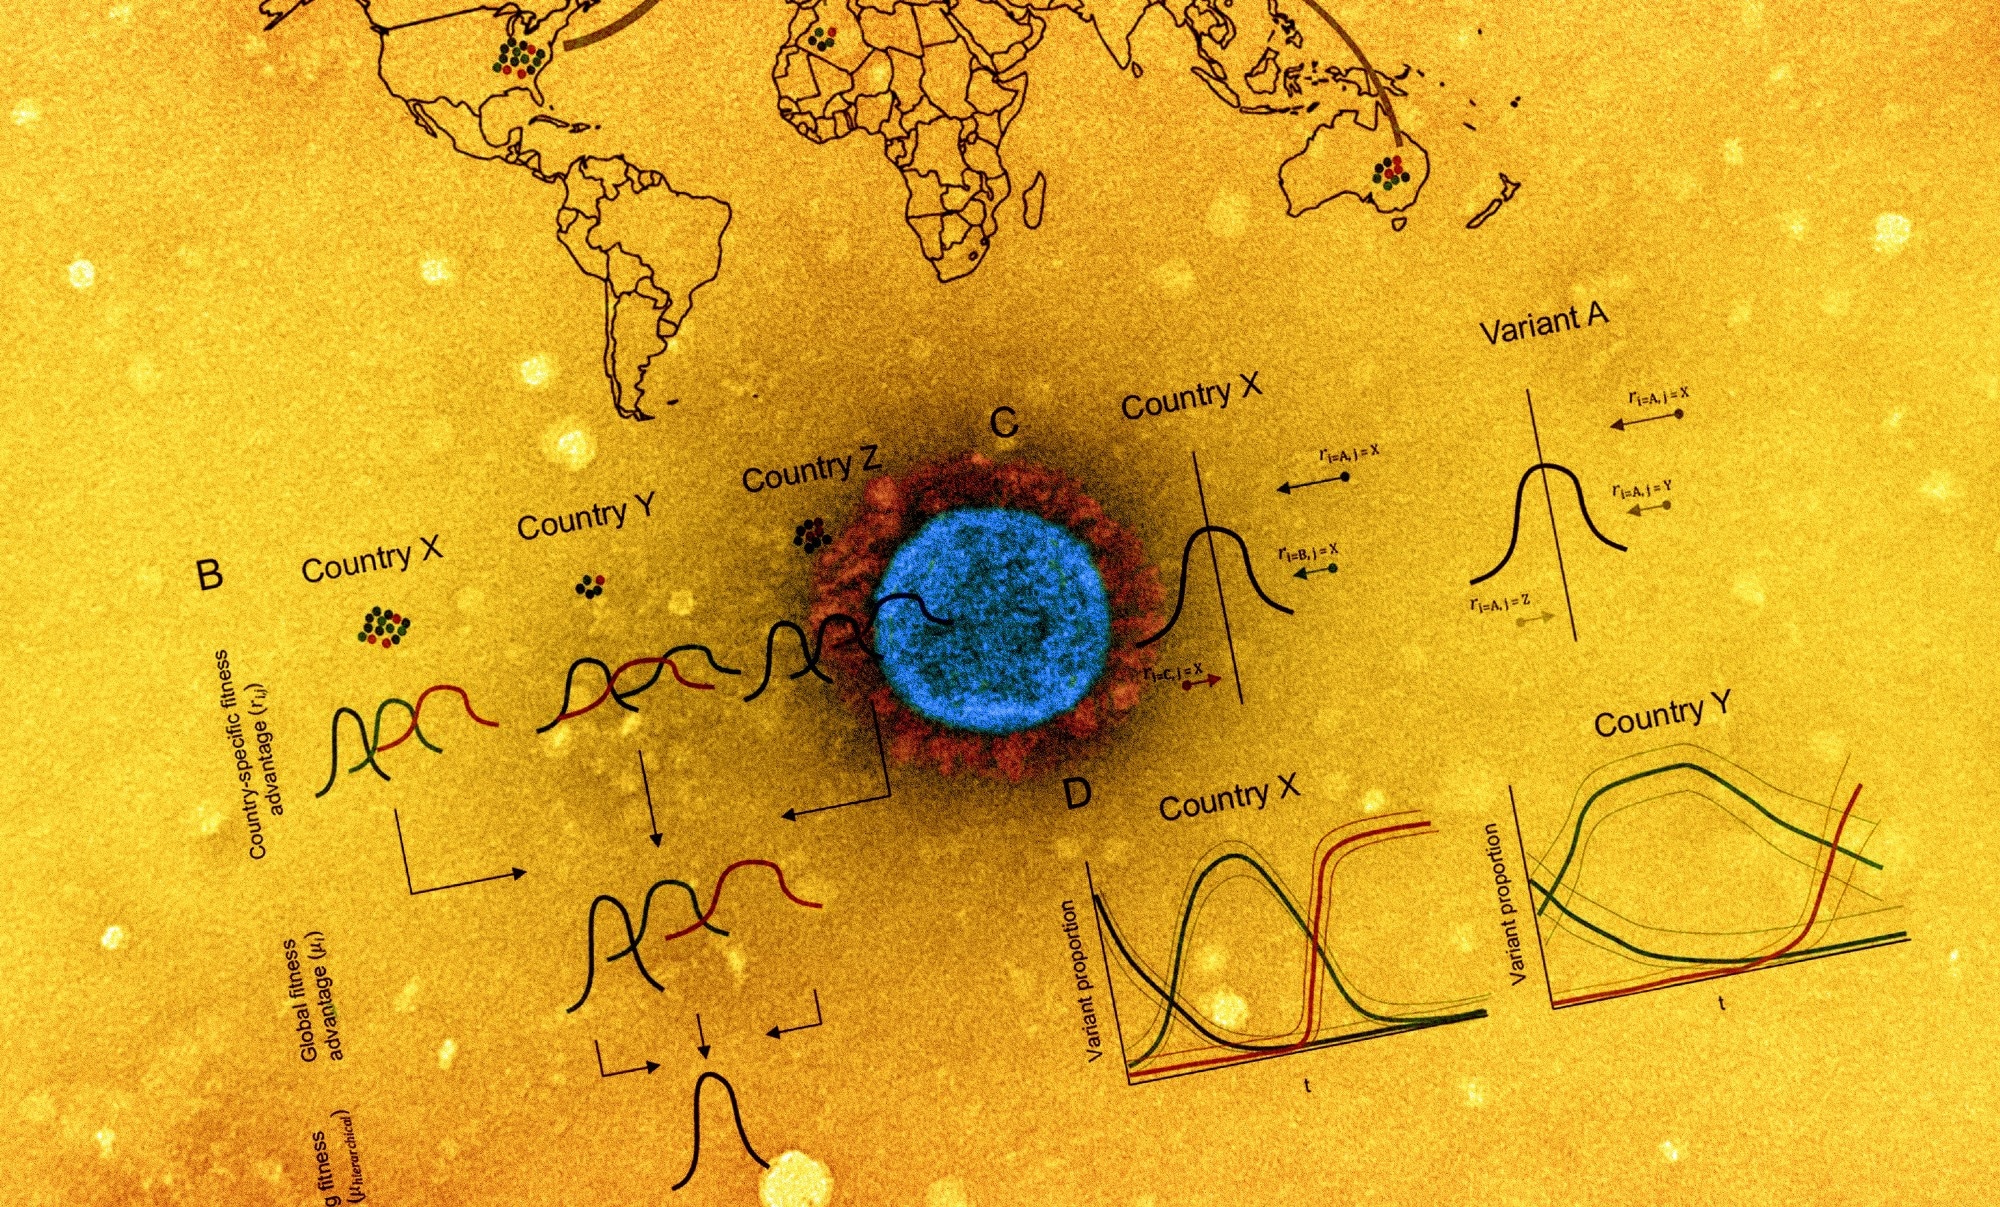
This approach leveraged a hierarchical mixed-effects Bayesian framework, and the model had two hierarchical levels. Country-specific fitness advantages of variants were structured in the first levels such that variant fitness advantage in one geography informed the expected variant fitness advantage in other locations. The mean fitness advantages of variants comprised a shared normal distribution in the second level.
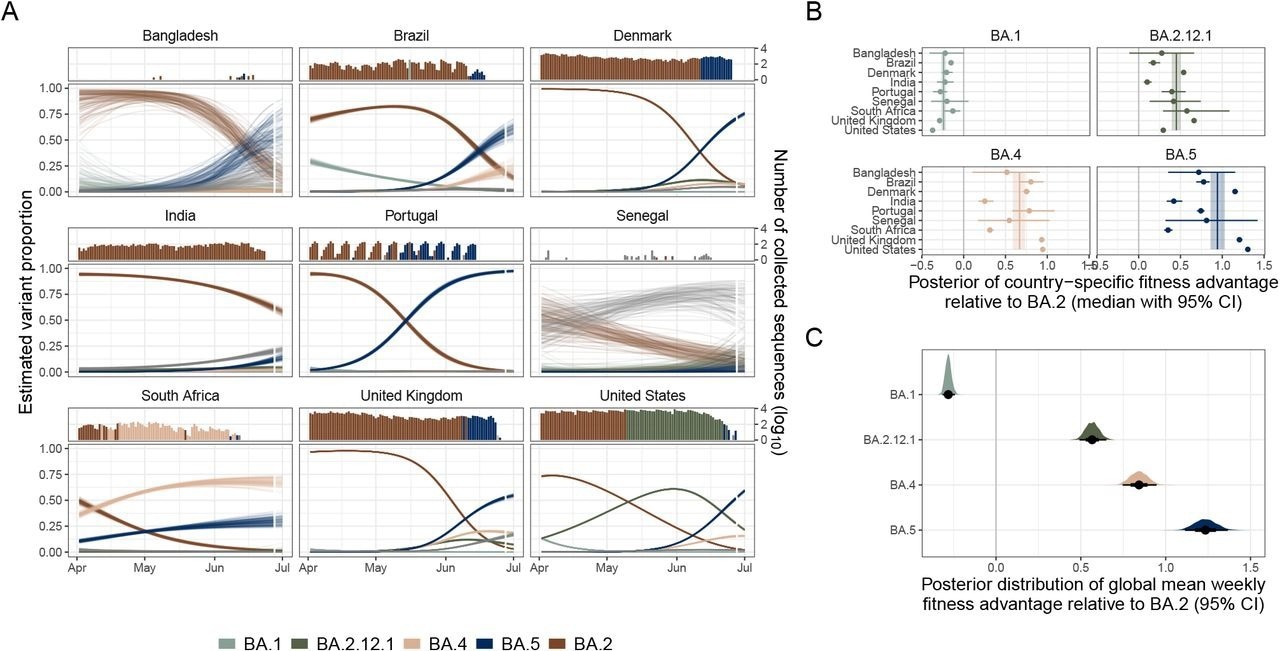
Using the specified modeling approach, the researchers estimated SARS-CoV-2 variant proportions for some countries. The global prevalence of SARS-CoV-2 Omicron BA.2 decreased by July 2022 as BA.4/5 variants quickly succeeded. The BA.4 and BA.5 variants exhibited heterogeneous invasion dynamics across countries. In Bangladesh and Israel, BA.5 had a higher observed growth rate.
Of note, the BA.5 variant cases were more in Bangladesh (56.5%) as of July 1, 2022, than in India (13.8%) despite the geographic proximity. Further, the researchers observed heterogeneity in country-specific fitness advantages by variant types. For instance, BA.4 and BA.5 variants had higher relative fitness in the US and the UK than in India or South Africa. However, for the BA.2.12.1 variant, the relative fitness was much lower in the US than in the UK.
The authors found that Omicron BA.5 had higher fitness than BA.2.12.1 or BA.4. The BA.2.12.1, BA.4, and BA.5 variants were more fit than the BA.2 variant. In comparison, the BA.1 variant had lower fitness than BA.2. In addition, the team retrospectively validated the model estimates from five successive reference dates: April 30, May 16, May 27, June 4, and June 27, 2022. Finally, the multi-country estimates were compared to those from a single-country fits (single-country model).
The emergence of Omicron BA.5 in Portugal was used in this validation. The model estimates were compared to the observed data as of July 1, 2022. The single-country model estimates exhibited broader uncertainty and sharper decline on early reference dates. The multi-country model had lower Brier scores than the single-country model for early reference dates, implying more accurate probabilistic prediction. The estimated fitness advantages were more stable in the multi-country model than in the single-country model.
 Estimating variant dynamics and fitness advantages. (A) The model estimated variant dynamics in a subset of countries. Colors indicate variants, and lines represent draws from the marginal posterior distributions of the country-specific estimates. The top panel shows the number of sequences collected over time, colored by the dominant variant at that time, as is observed in the data. (B) Country-specific fitness advantages for selected variants (points). The vertical line indicates a global estimate of variant fitness advantage. Bars and bands indicate 95% credible intervals. (C) Global posterior fitness advantage distributions for selected variants. Points indicate the median, and bars indicate 95% credible intervals.
Conclusions
In summary, the research team described a method to estimate the growth of competing variants globally and locally and applied it to emergent SARS-CoV-2 variants, highlighting the robustness of the model for variants with limited sequences and in regions with limited sequencing capacity. This approach can be relevant for low- and middle-income countries, increasing data for local public health decisions while building capacity for the future.

 *Important notice: medRxiv publishes preliminary scientific reports that are not peer-reviewed and, therefore, should not be regarded as conclusive, guide clinical practice/health-related behavior, or treated as established information.