Sponsored Content by InProcess-LSPReviewed by Louis CastelNov 6 2024
Nick Koumakis, Michiel Hermes, Yan Wang , Jan-Piet Wijgergangs, Carl Schuurmans, Rut Besseling
Abstract
Spatially Resolved Dynamic Light Scattering (SR-DLS) is an established technique for efficient nanoparticle size characterization for inline Process Analytical Technology as well as for at/off-line applications. Here a novel measurement mode, PhaSR-DLS, is introduced which supplements SR-DLS with Phase sensitive detection. This gives fundamental and significant improvements in the sensitivity and operational range of SR-DLS by direct access to the ‘Field Correlation Function’. The benefits of PhaSR-DLS are illustrated by highly resolved measurements on nanoparticle standards and mixtures, as well as by monitoring aggregation of Bovine Serum Albumin (BSA) protein solutions.
Introduction
For size characterization of nanoparticle (NP) suspensions across diverse fields like nanomedicine, biopharmaceuticals, specialty chemicals (e.g. coatings, inks, catalysts, polishing slurries), cosmetics and foods, Dynamic Light Scattering (DLS) is a broadly used technique. DLS measures intensity fluctuations (‘speckles’) of laser light scattered from a suspension, fluctuations that are due to the Brownian diffusion of the dispersed NPs. Via time-correlation analysis, the diffusion rate and thereby the size of NPs is derived, yielding a straightforward method for size characterization. However, different DLS instruments differ significantly in capabilities, such as accessible particle size, concentration and turbidity range of suspensions and in their suitability for different applications, such as the amount of sample preparation needed and the flexibility regarding measurement configurations. Complex requirements for these capabilities, especially in industrial settings, have meant that, despite the popularity of DLS, various applications in (intermediate/inline) product characterization have remained inaccessible.
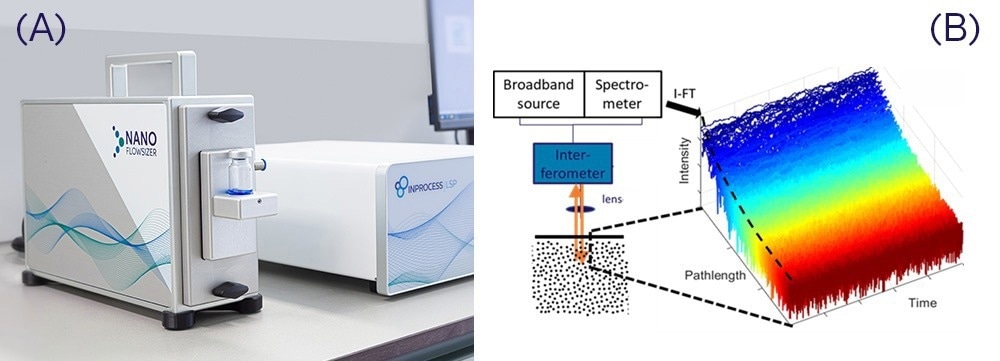
Figure 1. A) NanoFlowSizer with Probe Unit and Base Unit. B) NFS Detection scheme using ‘Fourier Domain Low Coherence Interferometry’ (FD-LCI) whereby scattering information at different depths is ‘instantaneously’ acquired at each time point from Fourier Transformation of interferograms obtained from the spectrum of backscattered broadband light. Image Credit: InProcess-LSP
Spatially Resolved DLS (available in the NanoFlowSizer products, Figure 1A is an advanced type of DLS with strongly enhanced capabilities. These include a very broad turbidity range, along with unique sizing capabilities of flowing suspensions (enabling inline use as Process Analytical Technology-PAT, 1, 2, 3)) and in a wide range of containers such as flasks, syringes, IV-bags and flow cells 4. The advanced turbidity and flow capabilities are directly linked to the fact that SR-DLS characterizes intensity fluctuations simultaneously at consecutive depths in the sample, enabled by Low Coherence Interferometry (LCI) technology shown in Figure 1B. The depth resolution allows spatial filtering of multiple scattered light for extremely turbid samples, and automatic analysis and correction of laminar flow, providing unbiased particle size in flows from ml/min to >200 L/hr 3. SR-DLS is thus an effective PAT tool for monitoring/control during nanosuspension manufacturing and for diverse other non-invasive applications 5.
PhaSR-DLS: Beyond intensity fluctuations
The LCI detection scheme and rich data of the NanoFlowSizer offer, besides spatial resolution, also the possibility to extract information beyond just the scattered intensity. The new PhaSR-DLS measurement mode introduced here, further exploits LCI to enable ‘Phase-sensitive’ SR-DLS measurements. PhaSR-DLS offers a significant extension of the operational range of NFS instruments in terms of sensitivity and resolution, by analyzing the ‘Electric Field Correlation’ function g(1). This is the most direct measure for NP diffusion and flow, but usually in DLS it is obtained only indirectlyA from the intensity correlation g(2). To understand the benefits of PhaSR-DLS, we first describe some general concepts and limitations in standard DLS.
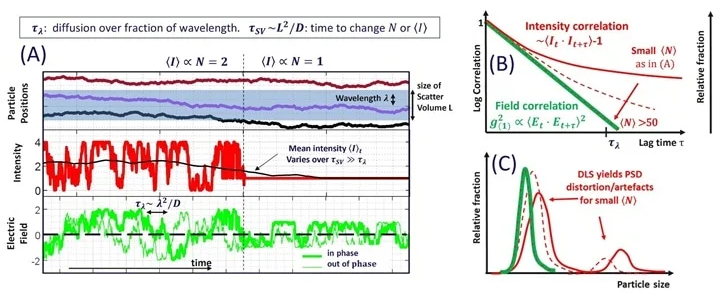
Figure 2. Concepts of Intensity and Electric field variations in light scattering measurements. A): Top: particle diffusion within/out of the scattering volume. Middle: Intensity fluctuations due to mutual particle motion over a fraction of the wavelength. Initially, scattered waves from two particles interfere from destructive (I∼0) to constructive (I=4) over the ‘fluctuation’ time τλ, set by the diffusion coefficient D and λ. Later, when only one particle is present, no interference or intensity variation occursB . The sketched slow variation of ⟨I⟩t (black) is detrimental in usual DLS. Bottom: Variations of the in/out of phase parts of the scattered electric field underlying the intensity. The signals have zero mean, higher information content, and fully characterize particle motion, even for a single particle. B) Correlation functions. Red: DLS intensity correlations at small ⟨N⟩ are affected by slow number fluctuations and baseline effects. Using the field correlation g2(1) (green) eliminates this, giving unbiased results regardless of ⟨N⟩. C) PSDs corresponding to (B): artifacts such as broadening and satellite peaks occur in the DLS-based PSD for small ⟨N⟩. In contrast, the correct PSD, from g2(1), is independent of ⟨N⟩. Image Credit: InProcess-LSP
Intensity variations in DLS arise from changes in interference of light waves scattered by multiple particles when their separation changes by a fraction of the wavelength λ. This is shown in Figure 2A, top and middle, at early times when two particles are present in the scattering volume. Relative motion of these particle causes the sum of individual scattered waves to change from maximum (for constructive interference) to 0 (destructive interference). This occurs over a time ∼τλ which follows from correlation analysis (Figure 2B) and yields the diffusion coefficient (via D∝λ2/τλ) and thus the particle size. However, using only intensity signals can limit or bias the information obtained in DLS. This is directly visible in Figure 2A,B at later times (marked by the dashed line), when one particle has diffused out: firstly, for a single particle (N=1), no interference occurs and thus intensity stays constant, incorrectly suggesting absence of diffusion. Second, when the overall mean number of particles ⟨N⟩ is small as in Figure 2A, a change N→N±1 has a strong effect on the variation of the mean intensity ⟨I⟩t, shown by the black trace.
The intensity correlation (Figure 2B, red) thus shows, besides the decay rate ~ 1/τλ , additional slow decay from changes in N, which vanish only if ⟨N⟩ is largeC. The Particle Size Distribution (PSD) analyzed from such data (Figure 2C) yields artifacts such as satellite peaks that incorrectly represent (overestimate) the actual particle size.
Intensity is however only part of the information available. More complete information is contained in the scattered (electromagnetic) field waves, indicated as ‘E'. Intensity represents the wave’s amplitude (I=|E2 |), but additionally the wave has a ‘lag‘ compared to the reference beam, which is the ‘phase’. Including this phase, one can consider both in-phase and out-of-phaseD components of the field, shown in the bottom panel of Figure 2A. Both fluctuate, with a rate 1/τλ due to particle motion, which occurs even for a single particle. Additionally, the average field is always zero, as opposed to the intensity. Thus, using the ‘field correlation function’, g(1), both the ‘single particle’ problem and slow number fluctuations are avoided. An additional advantage concerns noise reduction: in usual DLS, the effect of detector noise and finite sampling (limiting the accuracy of the PSD) can be limited only to some extent 6. Measuring the scattered field for size analysis, much more effective noise reduction is possible, see also 7, 8, 9.
The PhaSR mode now available in the NFS systems directly measures the in-phase and out-of-phase electric field fluctuations as in Figure 2A, with the same spatial resolution as SR-DLS. Full PhaSR signals are obtained from transformation of high-speed LCI spectra along with novel algorithms, available as an add-on to the XsperGo software. Subsequent analysis of the PhaSR correlation functions then proceeds as for SR-DLS data, giving real-time particle size data such as the cumulant Zav size and PdI, and full PSD characteristics. The key benefits of PhaSR-DLS that will be illustrated further are:
- Significantly reduced noise, improving PSD accuracy, precision and sensitivity.
- Extended application range by avoiding the influence of number fluctuations.
- Improved sensitivity: ability to characterize weak scattering samples such as proteins.
Extended PhaSR-DLS operational range
The extended operational range and improved data quality from PhaSR are first illustrated using monodisperse polystyrene standards. Samples were prepared in vials and measured with the NFS vial module using a Thalia-2 NFS system. In Figure 3A, full lines show PhaSR-DLS correlation functions g2(1) for 120 nm particles ranging in concentration from modest to very low turbidity. For the present ~10 s measurement, a decay of the correlation g2(1) well over 3 decades is observed, allowing to extract size information such as Z-av, PdI and PSD with high precision. For longer measurements, further decay of g(1) and a reduced ‘noise floor’ can be achieved, offering further improvement when even more detailed size characteristics are needed. PhaSR-DLS data can also be used for direct comparison with ‘traditional’ SR-DLS, since intensity fluctuations can be derived directly from PhaSR data via It = | Et2 | (see discussion of Figure 2). The resulting intensity correlation, shown for 8 x 10⁻³ vol.% (red-dashed) and 3 x 10⁻⁴ vol% (black dashed), highlights the improved data quality using phase-sensitive measurement: PhaSR data show reduced noise and bias at low correlation (for 8 x 10⁻³ vol.%) and fully avoid the number fluctuation artefacts visible in the DLS data for 3 x 10⁻⁴ vol% (upward curvature, see also Figure 2B).
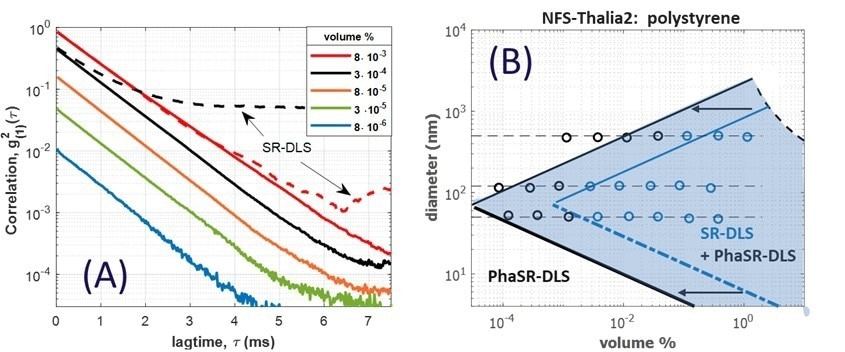
Figure 3. A): Full lines: PhaSR-DLS correlation functions of 120 nm polystyrene particles from ~10-2 to ~10-5 volume %. Dashed lines: SR-DLS intensity correlation from the same measurement, using I=|E2 |, for 8 x 10⁻³ vol.% (red) and 3 x 10⁻⁴ vol.% (black). The latter SR-DLS data clearly show number fluctuations (compare Figure 2B), which are absent using PhaSR-DLS. B) Accessible size-concentration range for polystyrene particles using the NFS-Thalia2 system. Black straight lines show conservative theoretical upper (thin) and lower (thick) size limits for PhaSR, Blue lines show indicative boundaries for SR-DLS. PhaSR provides a factor of at least 20x reduction in lowest accessible concentration. The curved-dashed right upper boundary indicates a maximum turbidity limit. Data points: measured Z-av values for different particle size and concentrations; blue data indicate successful measurements using both PhaSR and SR-DLS, black data show measurements enabled by PhaSR only. Horizontal dashed lines: reference value. Image Credit: InProcess-LSP
Based on the above and similar measurements for different sizes, a diagram for the size and concentration of polystyrene suspensions accessible for measurement can be constructed. Figure 3B shows the measurable range for the current NFS-Thalia2 system, with conservative boundaries for both SR-DLS and PhaSR (shown as drawn lines) based on optical specifications, fundamental characteristics of SR-DLS and PhaSR-DLS, and known properties of polystyrene particles. The data points show the measured Z-av particle sizes for different concentrationsE. Black points indicate measurements possible only with PhaSR-DLS. For the blue points both PhaSR and SR-DLS were applicable. The diagram shows that by using PhaSR, measurements can be made for concentrations typically more than a factor 20 lower compared to SR-DLS. Depending on particle size, the range of concentrations for PhaSR-DLS measurement can thus cover up to 5 decades.
PhaSR enhanced accuracy and precision of PSD: resolving small fractions in binary NP mixtures
An important aspect for characterization of more typical polydisperse samples is the ability to resolve details of the PSD. In standard DLS, resolving small fractions of a single larger population in mixtures of nanoparticles of different sizes can be difficult 10, particularly for instruments operating near backscattering 11,12 (exact limits depend on size, contrast and wavelength). Using PhaSR-DLS, a significant enhancement in resolving a large particle population – and generally large particle ‘tails’ in the PSD of polydisperse samples - can be achieved. The data in Figure 4 show an overview of measurements of bi-disperse suspensions consisting of 200 nm and 50 nm polystyrene particles, mixed in volume ratios in the range 10-4 – 1, prepared with a fixed concentration of the 50 nm particles of 0.3 vol%. Figure 4 (A) shows the measured PhaSR correlation functions. Due to the extended correlation range, the tail signature of the 200 nm particles can already be observed for a fraction 2 x 10⁻⁴, and a systematic increase in its weight occurs for larger fractions.
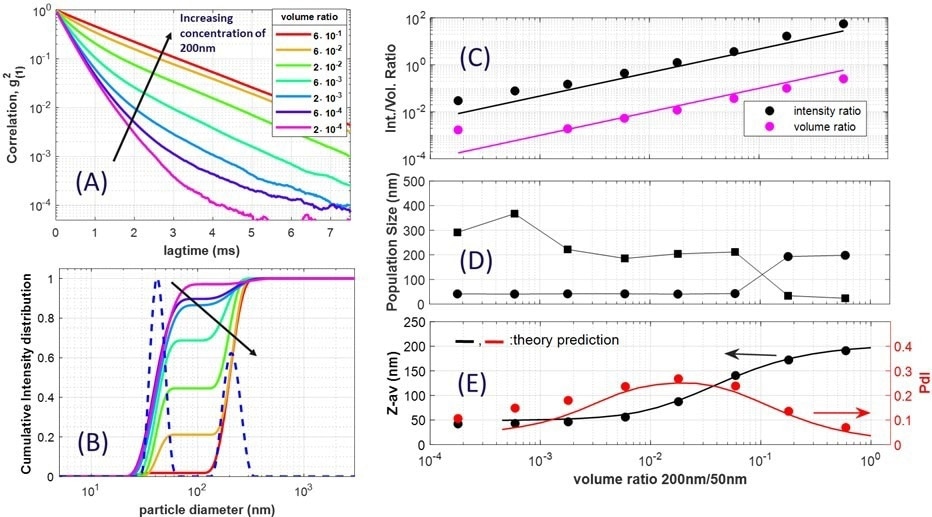
Figure 4. A) PhaSR-DLS correlation functions of mixtures of 50 nm and 200 nm particles at different volume ratios shown in the legend. Increasing the concentration of the 200 nm particles, the increased contribution in the tail of the decay is clearly observed. B) Full lines: Cumulative intensity PSDs corresponding to the data in A) showing that intensity fractions well below 10% and above 95% can be resolved. The dashed line shows the usual intensity weighted PSD corresponding to the data at a volume ratio of 6 x 10⁻⁴ (blue). C) Intensity ratios (black) and PSD volume ratios (magenta) of the two species, from the PSDs, as function of the experimental volume ratio. The lines are the expected ratios from Mie calculations (slope ~47) and the volume ratio (slope 1). D) Corresponding particle size of the main/second PSD peak. E) Corresponding Z-av size (black, left) and Polydispersity index from cumulant analysis (red, right) of data in A). Lines are from ideal bidisperse simulations. Image Credit: InProcess-LSP
The corresponding intensity-based PSD’s extracted from Figure 4A (using NFS XsperGo software) are shown in cumulative form in Figure 4B, along with an example of the bare PSD. The data exhibit the characteristic two-step increase of a bi-disperse suspension, with steps centred around 50 nm and 200 nm. Even for an intensity weight <5%, both large and small populations can be adequately characterized. In Figure 4C, the relative intensity weights of the two PSD peaks is shown as a function of the volume ratio. As expected, the intensity ratio increases linearly, with a slope given by the Mie-backscatter ratios of the two species (~47 for equal concentrations). Remarkably, the PhaSR measurements allow to resolve the large particles down to a concentration of less than 1/1000 of that of the small particles, which corresponds to an intensity ratio of ~1/20. Using the particle refractive index as input, the intensity correlations can be converted into volume PSDs. The equivalent volume ratios are also shown in Figure 4C. In Figure 4D, the particle size corresponding to the PSD is also shown. Over most of the range, the size of the individual populations is measured correctly (within ~20%), while for the smallest fraction deviation is observed, linked to the small intensity weight of the peak. As a result some deviation in the trend for the volume ratios is seen in Figure 4C.
Useful extra information comes from cumulant analysis of the mean size and polydispersity, shown in Figure 4E: the Z-av data show the expected increase from ~50 nm to 200 nm, while the polydispersity index PdI exhibits a maximum when the peak intensity ratio is ~1. This can be compared to simulations of ideal bidisperse suspensions, obtained using a numerical tool (available from InProcess-LSP upon request). The simulation results for Z-av and PdI confirm the experimental trend, showing consistency of the PhaSR results. It is noteworthy that the NFS, which operates as a non-invasive backscatter instrument, with the PhaSR-DLS mode allows reaching the reported level of detail of PSD information, which is challenging for other (purely off-line) DLS instruments even those operating at smaller scattering angles e.g. 90degrees 13.
Monitoring details of protein aggregation
The PhaSR-DLS mode offers a significant extension of the possible applications of SR-DLS. An important example is the non-invasive monitoring of the characteristics of protein solutions, which is strongly relevant for development and manufacturing of biopharmaceuticals. The stability, interactions and the potential for aggregation of proteins are prime factors in the processing of these products, ultimately affecting the efficacy of pharmaceutical end products.
Here the NFS-Thalia2 instrument with PhaSR-DLS mode was employed to monitor the thermal unfolding and aggregation of Bovine Serum Albumin (BSA) solutions over several hours. BSA (Sigma-Aldrich), was fully dissolved at room temperature in a vial (0.1M NaCl solution, 5mg/ml of BSA) without stirring or agitation. The vial was partially immersed in an oil bath positioned on a hot plate, with a portion exposed for measurement by the NFS, and the rest appropriately insulated. The temperature measured in the solution was controlled quickly to T=65 °C. No aggregation occurred below T=60 °C and the remaining temperature increase (from 60 to 65 °C) occurred within 4 minutes, at which point the start of the experiment was defined and temperature was kept stable. The unique, flexible non-invasive NFS backscattering geometry is fully exploited here for measurement with tight control over the experimental parameters.
Figure 5A, shows the evolution of the size characteristics of the solution as the aggregation commences with the temperature stabilized at 65 °C (the corresponding solvent viscosity was accounted for in the software). The data show both the mean particle size (cumulant Z-av) and the 10, 50 and 90 cumulative percentile sizes of the intensity-based size distribution, d10, d50 and d90. The Z-av mean size (and d50) reveal a relatively rapid (~20 mins) initial increase in the BSA size, from the initial size ~8 nm up to ~25 nm. After this initial increase, a much more moderate size increase is observed which slows down somewhat at the later stages of the experiment but without saturating.
In Figure 5B the corresponding intensity-based PSDs, measured at the start and at 4 later time points from the initial to the late stage are highlighted. The main PSD peak in the initial stage – minimally unfolded/aggregated state of the protein- rapidly decreases in intensity weight in the first 5 minutes, at which point the formation of larger aggregates of ~20 nm can be observed as a shoulder in the PSD. At later stages (t>30 mins), clear individual PSD peaks occur, corresponding to protein aggregates, which slowly increase in size. Remarkably, during this process, the presence of BSA ‘monomers’ can still be detected, albeit with an intensity weight that rapidly decreases as they are progressively being taken up in the aggregate population. The aggregate population quickly becomes dominant and slowly grows to a size of ~60 nm, but even at that stage ‘monomers’ are still present.
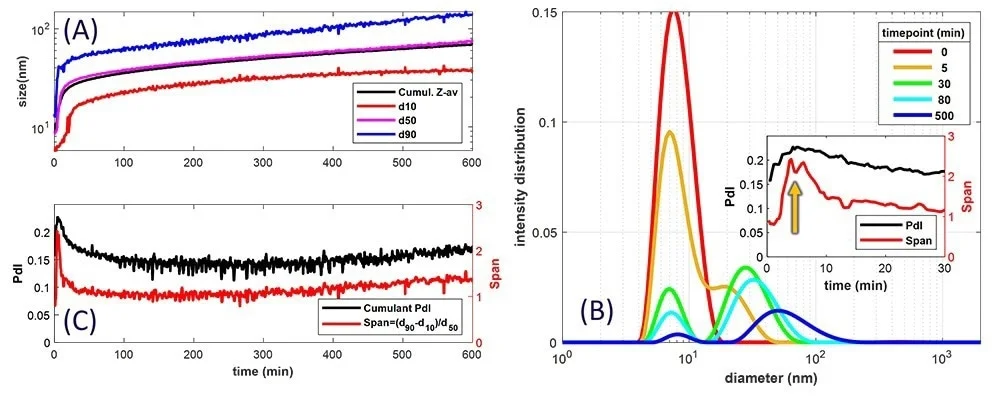
Figure 5. Using the NanoFlowSizer Thalia-2 with PhaSR-DLS mode to monitor details of BSA-protein solutions during thermal unfolding and aggregation A) Z-av size and cumulative percentile sizes d10, d50 and d90, of the intensity-based size distribution. B) Intensity-based size distributions at different stages of the experiment. Inset: Characteristic of the width of the distribution during aggregation, for the first 30 minutes: black: the polydispersity index obtained from cumulant analysis, red: the span obtained from the intensity distributions C) The PdI and span for the whole time scale of the experiment. Image Credit: InProcess-LSP
Additional detail of the evolution of the PSDs is shown in the inset for the first 30 min and in Figure 5C for the total duration. The cumulant PdI (the usual measure of polydispersity in DLS) exhibits a maximum during the initial stage of the process at 5 min. Similar to what is shown in Figure 4C for the binary mixtures, such a peak characterizes the bimodal nature of the BSA solution in the early stage. In the mid to late stage, the aggregates dominate and the PdI is reduced. In the later stage of the process, there is a slow increase of the PdI indicating the slowly evolving spread in the distribution of aggregate sizes. An alternative measure of the distribution width, the ‘span’ (d90 - d10) / d50, shows qualitatively a very similar picture, and highlights the maximum relative spread of the PSD in the early stage more clearly. The PhaSR-DLS data shown here provide novel information on details of protein aggregation and can further contribute to the interpretation of aggregation mechanisms, as done in 14. In addition, the present PhaSR-DLS method may be employed for direct non-invasive at-line or inline characterization of protein destabilization.
Conclusion
The present paper has introduced a significant advancement in non-invasive and inline characterization of nanoparticle suspensions and macromolecular solutions by extending Spatially Resolved Dynamic Light Scattering with phase-sensitive detection: PhaSR-DLS. Direct measurement of the field correlation function, as opposed to the usual DLS intensity correlations, offers strong benefits in terms of resolution and accuracy of size characteristics, and specifically in terms of size and concentration ranges accessible for non-invasive measurements using NanoFlowSizer SR-DLS instruments. The PhaSR-DLS benefits carry over to the known inline applications of SR-DLS in flowing dispersions 2,3. The practical benefits of PhaSR-DLS have been highlighted by the improved characterization of mono and bi-disperse nanoparticle standards, and by highly resolved measurements of aggregation of BSA proteins.
Footnotes
A g(1) follows from g(2)−1∝|g(1)|2, under appropriate conditions. ‘Heterodyne DLS’ systems can also yield information on g(1).
B For explanatory purposes a ‘discrete’ scattering volume is shown where intensity of a single particle vanishes abruptly when it leaves the volume. In reality the single particle intensity decays smoothly, e.g. due to beam shape.
C For large ⟨N⟩, a change N→N±1 due to a particle moving in/out the scattering volume has relatively little effect on the intensity.
D ‘In-phase’ refers to zero lag between the scattered wave and the source light. ‘Out-of-phase’ means a lag of half the wavelength.
E All concentrations for each size batch were scaled using the appropriate Mie scattering intensity of a 100 nm reference standard to account for some observed deviation in the stock concentrations.
References
- Sheybanifard, M., et al. (2022). Liposome manufacturing under continuous flow conditions: towards a fully integrated set-up with in-line control of critical quality attributes. Lab on a Chip, [online] 23(1), pp.182–194. https://doi.org/10.1039/D2LC00463A.
- Rut Besseling, et al. (2021). REALTIME DROPLET SIZE MONITORING OF NANO-EMULSIONS DURING HIGH PRESSURE HOMOGENIZATION. [online] https://doi.org/10.13140/RG.2.2.30640.28166.
- Schuurmans, C.C.L., et al (2022). Inline particle sizing in flow for demanding nanosuspension processes. [online] https://doi.org/10.13140/RG.2.2.18231.80805.
- Grau-Carbonell, A., et al. (2024) How can you measure particle size CQAs in (sterile) pharmaceutical packaging? – Non-invasive measurements using SR-DLS. AZONANO. Available at: https://www.news-medical.net/whitepaper/20241106/How-can-you-measure-particle-size-CQAs-in-(sterile)-pharmaceutical-packaging-e28093-non-invasive-measurements-using-SR-DLS.aspx. Accessed on: May 28, 2024.
- Rooimans, T., et al. (2023). Development of a compounded propofol nanoemulsion using multiple non-invasive process analytical technologies. International Journal of Pharmaceutics, 640, p.122960. https://doi.org/10.1016/j.ijpharm.2023.122960.
- Klaus Schätzel, Drewel, M. and Stimac, S. (1988). Photon Correlation Measurements at Large Lag Times: Improving Statistical Accuracy. Journal of Modern Optics, 35(4), pp.711–718. https://doi.org/10.1080/09500348814550731.
- Cheishvili, K. and Kalkman, J. (2023). Sub-diffusion flow velocimetry with number fluctuation optical coherence tomography. Optics express, [online] 31(3), pp.3755–3773. https://doi.org/10.1364/OE.474279.
- Taylor, T.W. and Sorensen, C.M. (1986). Gaussian beam effects on the photon correlation spectrum from a flowing Brownian motion system. Applied optics, [online] 25(14), p.2421. https://doi.org/10.1364/ao.25.002421.
- Schaefer, D.W. and Berne, B.J. (1972). Light Scattering from Non-Gaussian Concentration Fluctuations. Physical Review Letters, 28(8), pp.475–478. https://doi.org/10.1103/physrevlett.28.475.
- Kaszuba, M., et al. (2007). Resolving Concentrated Particle Size Mixtures Using Dynamic Light Scattering. Particle & Particle Systems Characterization, 24(3), pp.159–162. https://doi.org/10.1002/ppsc.200601035.
- Finsy, R., et al. (1993). Particle Sizing by Photon Correlation Spectroscopy. Part IV: Resolution of bimodals and comparison with other particle sizing methods. Particle & Particle Systems Characterization, 10(3), pp.118–128. https://doi.org/10.1002/ppsc.19930100304.
- Filipe, V., Hawe, A. and Jiskoot, W. (2010). Critical Evaluation of Nanoparticle Tracking Analysis (NTA) by NanoSight for the Measurement of Nanoparticles and Protein Aggregates. Pharmaceutical Research, [online] 27(5), pp.796–810. https://doi.org/10.1007/s11095-010-0073-2.
- Kato, H., Nakamura, A. and Kinugasa, S. (2018). Effects of Angular Dependency of Particulate Light Scattering Intensity on Determination of Samples with Bimodal Size Distributions Using Dynamic Light Scattering Methods. Nanomaterials, 8(9), p.708. https://doi.org/10.3390/nano8090708.
- Borzova, V.A., et al. (2016). Kinetics of Thermal Denaturation and Aggregation of Bovine Serum Albumin. PLoS ONE, [online] 11(4). https://doi.org/10.1371/journal.pone.0153495.
About InProcess-LSP
InProcess-LSP, headquartered in Oss at Pivot Park, is a rapidly growing, innovative company founded in 2014. Backed by a team of in-house experts—comprising physicists, chemists, and software engineers—InProcess-LSP is at the forefront of nanotechnology solutions. The company’s leading product, the NanoFlowSizer, is a cutting-edge instrument designed to deliver inline, real-time measurements of nanoparticles in solution, making it indispensable across various industries.
Utilizing Spatially Resolved Dynamic Light Scattering (SR-DLS) technology, the NanoFlowSizer enables accurate characterization of nanoparticles in flowing liquids, providing critical data such as hydrodynamic diameter, polydispersity index (PDI), and D90 within seconds.
This state-of-the-art instrument empowers both scientists and industries by offering a robust solution for analyzing nanoparticle properties, paving the way for breakthroughs in product development, improved formulations, and pioneering applications.
Innovators in process analytical technology and nanoparticle characterization.
With their strong background in process analytics as well as many years of academic and industrial experience InProcess offer a highly skilled and experienced team of scientists and process specialists addressing the needs of your PAT and nanotechnology challenges.
Sponsored Content Policy: News-Medical.net publishes articles and related content that may be derived from sources where we have existing commercial relationships, provided such content adds value to the core editorial ethos of News-Medical.Net which is to educate and inform site visitors interested in medical research, science, medical devices and treatments.