Sponsored Content by InProcess-LSPReviewed by Louis CastelMar 26 2025
Rut Besseling, Jan-Piet Wijgergangs, Michiel Hermes, Nick Koumakis, InProcess-LSP The Netherlands
In downstream processing of biopharmaceutical products, protein aggregation presents one of the main risks in terms of therapeutic efficacy, safety and quality of these products. This study demonstrates monitoring of aggregation dynamics of BSA protein solutions during peristaltic pumping, with a single instrument (NanoFlowSizer) that measures both submicron and rare subvisible particles. The results show a near linear increase in both aggregate types with processing time. The unique dual-mode approach enables efficient, non-invasive quality control in protein downstream processing.
Introduction
Protein-based therapeutics have transformed treatments for numerous diseases, yet their production remains highly complex and cost-intensive [1][2],[3][4]. Downstream processing (DSP), including chromatography, ultra/diafiltration and fill-finish, often constitutes a major fraction of manufacturing expenses, and may account for more than half of total production costs. A central challenge in DSP is product stability, as biopharmaceutical proteins can be highly sensitive to environmental stresses, causing protein aggregation, reduced therapeutic efficacy and immunogenic risks.
Among the various forms of protein aggregates, subvisible (~1–100 µm) and submicron (<1 µm) particles are of particular regulatory and clinical concern. Conventional methods for measuring them typically involve multiple techniques, e.g. Light Obscuration for subvisible particles (see e.g. USP<788>) or Dynamic Light Scattering (DLS) for submicron analysis. This creates logistical, economic, and practical challenges in process development or manufacturing settings. A unified approach that quantifies both subvisible and submicron particles with a single instrument provides a more streamlined and comprehensive assessment of product stability at various DSP stages, helping manufacturers mitigate aggregation during the most costly processing steps.
This paper describes such an approach. An instrument providing in parallel advanced Spatially Resolved DLS and imaging (NanoFlowSizer) was employed to monitor protein aggregates of different sizes during a peristaltic circulation process. Such a monitoring strategy at critical downstream operations can help to illuminate where and how aggregation is triggered, keep control over Critical Quality Attributes, and support a more cost-effective, quality-focused DSP. The results underscore the value of advanced particle characterization tools in safeguarding therapeutic protein integrity while reducing resources and complexity of current workflows.
Protein aggregation by mechanical stress and process impact
Protein aggregation often arises from the partial unfolding of proteins, which exposes hydrophobic regions prone to self-association. While chemical factors like pH and temperature play key roles, mechanical stress and wall interactions—such as shear forces generated by pumping, stirring, or filtration—can also drive and accelerate aggregation5. Under high shear, proteins can undergo conformational changes, leading to clusters of misfolded molecules. Once formed, aggregates may continue to grow through secondary nucleation events, exacerbating the problem.
From a manufacturing standpoint, protein aggregation can severely impact the most cost-intensive parts of downstream processing, reducing overall product yield and purity. Filtration membranes can become fouled by aggregates, reducing flow rates, increasing differential pressures, and necessitating frequent cleaning or replacements. Chromatography columns can lose efficiency when overloaded with aggregated material, elongating process times.
These factors translates directly to higher labor, equipment, and material expenses. Moreover, stringent quality requirements in biopharmaceutical production underscore the need for aggregate-free products to mitigate e.g. immunogenicity risks. There are thus significant investments in strategies to detect and prevent aggregation, from buffer optimization and lowering shear through gentle mixing/transport protocols, to the use of specialized equipment designs, both for individual DSP steps and for their monitoring.
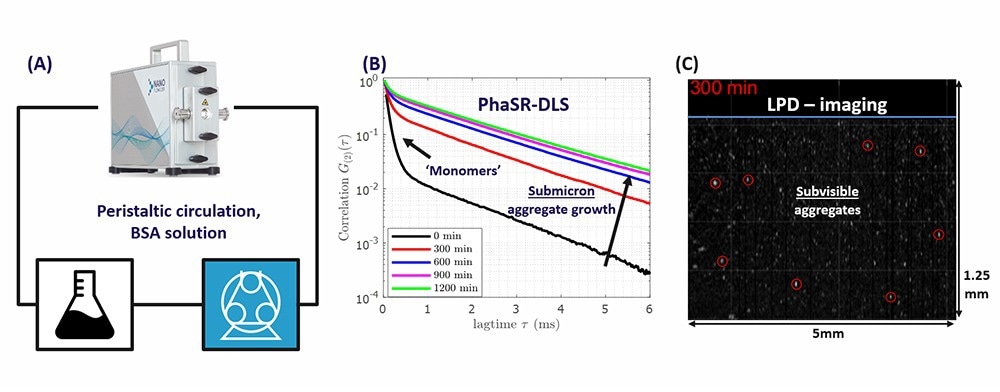
Figure 1. A) Peristaltic loop for circulating BSA solution, including the NanoFlowSizer (NFS) with a ¼ inch flow cell. B) PhaSR measurements of DLS correlation functions of the BSA solution, after different circulation times. C) Snapshot of an LPD-movie, after 5hr circulation. Encircled particles have an estimated size1 > 1μm. The blue line marks the glass wall of the flow cell. Image Credit: InProcess-LSP
Advanced Dynamic Light Scattering and Imaging combined
The method of Spatially Resolved Dynamic Light Scattering—unique for the NanoFlowSizer (NFS) instruments (Fig.1A)—has established itself as a versatile technique for advanced, fast, and non-invasive size characterization of nanosuspensions.6,7,8,9,10
Two new measurement modes introduced in the NFS (PhaSR-DLS and LPD, see Fig. 1B and C) make the instrument particularly suited for characterizing biopharmaceuticals and protein aggregates over different size and concentration ranges:
(i) PhaSR-DLS provides highly sensitive phase-resolved DLS data to measure both protein monomers and small concentrations of aggregates down to ~108 particles/ml.11
(ii) The ‘Large Particle Detection’ (LPD) mode enables rapid cross-sectional video imaging, allowing for the detection of rare large aggregates at concentrations as low as <104/ml.12 A snapshot of an LPD image sequence is shown in Fig. 1C.
Monitoring protein aggregate formation by peristaltic pumping
In this study, the NanoFlowSizer-Thalia2 instrument was integrated into a peristaltic pumping cycle2 in which a 5 mg/ml BSA suspension (in 0.1 M NaCl) was circulated at a relatively high flow rate of ~3.6 L/hour (see Figure 1A). This mimics situations that may occur in DSP process development, in which significant mechanical stresses during suspension transport can affect product stability and quality.
Monitoring of the Particle Size Distribution (PSD) and the aggregation state of the suspension during extended peristaltic pumping was carried out using a cycle of 10 seconds of continuous pumping followed by a 25-second pause. During each pause, PhaSR-DLS and LPD measurements were taken and recorded in real time via the software.
Although both PhaSR-DLS and LPD are compatible with continuous-flow measurements, the paused-flow method was chosen in this case (controlled via software) to ensure the highest quality PhaSR-DLS data for detecting submicron aggregates—without needing to limit the flow rate or use a larger NFS flow cell.
Footnote:
1 A monotonous approximation, similar to that in [15], was employed for the backscattering intensity of protein aggregates. These aggregates are assumed here to have irregular shapes and a refractive index ~1.45. Note that the RI and standards for protein aggregate characterization is an active research field, see [16]
2 Using a Flexicon PF7 peristaltic pump and 1.2mm Accusil Platinum cured tubing. Total volume of BSA suspension: ~100ml. The mean wall shear rate in the tubing away from the peristaltic rollers is ∼5000 s^(-1).
Submicron Aggregates
The data in Figure 1B show PhaSR-DLS correlation functions after different circulation times. The two decay rates in the data clearly highlight the presence of the BSA ‘monomers’ (fast decay), along with a contribution from aggregates (slow decay).
The latter starts at a residual level for the initially prepared solution (0 min) and increases on continued circulation. The intensity based PSDs from the PhaSR-DLS data, displayed in Figure 2A, shows that the aggregates have a hydrodynamic diameter ~150-400nm. The intensity fraction of this contribution systematically increases with process time, at the expense of the monomers.
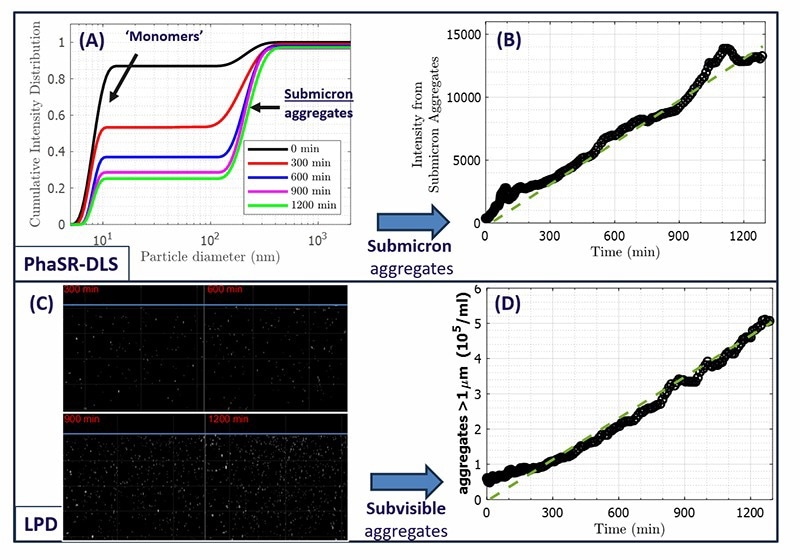
Figure 2. A) Particle Size distributions from PhaSR-DLS, at the timepoints in Fig.1B). Prolonged circulation causes an increasing intensity fraction of submicron aggregates. B) The resulting scattered intensity from submicron aggregates increases approximately linearly with circulation time. C) Snapshots of LPD image series after different circulation times (for clarity, an intensity threshold was chosen to show particles >800 nm in size). D) Concentration of ‘subvisible’ aggregates (size exceeding ∼1 μm) from LPD histograms, as function of processing time. After the first ∼100 minutes where pre-existing aggregates dominate, the aggregate concentration grows approximately linearly. Image Credit: InProcess-LSP
As temperature was kept at ambient level and other factors were also constant, the aggregation is most likely due to the mechanical stresses from peristaltic pumping. Particularly in the “pinch” regions of the tubing where the rollers compress the fluid, such stresses can be strong, proteins may absorb on the tubing followed by desorption in the form of aggregates 5,13,14. For the submicron aggregates observed by PhaSR-DLS, scattering intensity estimates3 indicate that these aggregates contribute at most <0.1 vol% of the total protein.
Footnote:
3 Based on Rayleigh approximation.
For a more direct signature of the evolution of submicron aggregates, the intensity fraction from PhaSR-DLS can be combined with the total scattered intensity to analyse the scattered intensity only from submicron aggregates. The result is shown in Fig. 2B for the full >20hr course of the circulation run, indicating that the intensity from aggregates grows in proportion to the processing time.
Subvisible Aggregates
While the data in Fig. 2A,B do not clearly highlight aggregates larger than ~1 μm (labelled ‘subvisible’ here), such aggregates are in fact present, but at much lower levels, at which PhaSR-DLS (or standard DLS) cannot accurately measure them.
Here the LPD imaging mode of the NFS instrument is well suited to resolve these ‘rare’ subvisible particles. In Fig. 2C, snapshots of LPD image series at different time points are shown (for clarity, a threshold was chosen to show aggregates >~800nm, see1), indicating the increase in concentration of these large aggregates over time.
Using intensity histograms of the LPD image sequences at each time point 12, the increase in subvisible aggregates can be monitored simultaneously with the PhaSR-DLS data on submicron aggregates. The LPD results are shown in Fig. 2D. Starting from a small concentration, during circulation the concentration of subvisible aggregates grows approximately linear in time.
Overall, the data in Fig. 2 strongly indicate that both submicron and subvisible aggregate concentrations are proportional to the time that the formulation is exposed to the mechanical stress. The significantly smaller fraction of subvisible particles (compared to submicron particles) is very hard or impossible to detect in standard DLS. Using the NFS with LPD uniquely provides the dual measurement capability shown in Fig. 2. Note that the contribution of subvisible particles to the total intensity is negligible, but they are nevertheless resolved in LPD. Submicron and subvisible particle measurements that usually require orthogonal (‘ensemble’ versus ‘single particle’) methods, can thus be characterized with the NanoFlowSizer instrument as a single non-invasive technique.
Irreversible nature of the aggregates: mixture tests
An aspect of protein aggregates often discussed in literature is their reversible or irreversible character. To assess this for the circulation run, the final aggregated suspension, after >20h of circulation, was mixed in vials with the starting suspension at different fractions.
Using the NFS vial module, both PhaSR and LPD measurements were performed. The intensity from the submicron aggregates (via PhaSR-DLS) and the concentration of subvisible aggregates (from LPD) in the mixtures are shown in blue in Figure 3A and B, along with the results of the circulation run (black). The mixture data show that the concentration of both aggregate types changes -within measurement uncertainty- proportionally to the mixture fraction.
The PSD data from PhaSR-DLS confirmed that the size of submicron particles was independent of mixture fraction. Thus, aggregates formed by peristaltic pumping are stable and only reduced in concentration when mixed with the original solution. The overlay with the peristaltic cycle data confirms the near linear increase of aggregate concentrations with time for the latter.
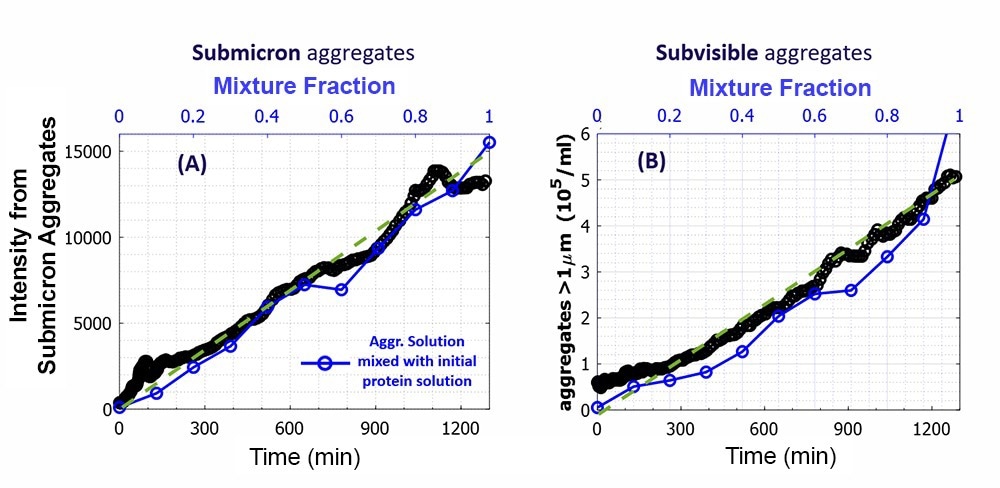
Figure 3. A) Scatter intensity from submicron aggregates in the formulation and B) concentration of subvisible aggregates, as in Fig. 2B and D (versus time). The data are supplemented with the blue data of mixtures of the final aggregated solution and the original protein solution at different fractions of the aggregated solution, marked by ‘mixture fraction’. Image Credit: InProcess-LSP
Lower concentration limits of LPD measurement
Aggregate detection may be desired at levels significantly lower than discussed so far. As an example, in USP<787> for therapeutic proteins, particles ≥10μm may be present only at a level ≤25 particles /ml in the final product. As mentioned, PhaSR-DLS (or standard DLS) is unable to reliably measure at these levels.
To assess detection levels of LPD under the employed conditions (<20s acquisition), two additional series of protein samples were prepared over 4 decades in concentration: (i) ‘Mixtures’ of a strongly aggregated BSA solution with a fresh BSA solution with residual aggregates and (ii) ‘Dilutions’ of the same aggregated BSA solution using filtered water. In Fig.4 the aggregate concentration (using a somewhat smaller threshold intensity corresponding to ~750nm particles) for the ‘Mixtures’ is shown in blue. It is proportional to the mixture fraction for fractions >0.02, while at lower fractions, a plateau occurs indicating the residual aggregate concentration.
In contrast, for the ‘Dilutions’ of the aggregated solution with filtered water, the aggregate concentration is proportional to dilution down to <10^3 particles/ml. This highlights the complementary character of LPD and PhaSR: the latter provides high-sensitivity DLS data, the former provides very low concentration capabilities usually only offered by ‘single particle’ techniques.4
Footnote:
4 Note that also for well-established single particle techniques, measurements of subvisible particles may be significantly biased due to presence of submicron or ‘sub-countable’ particles 17
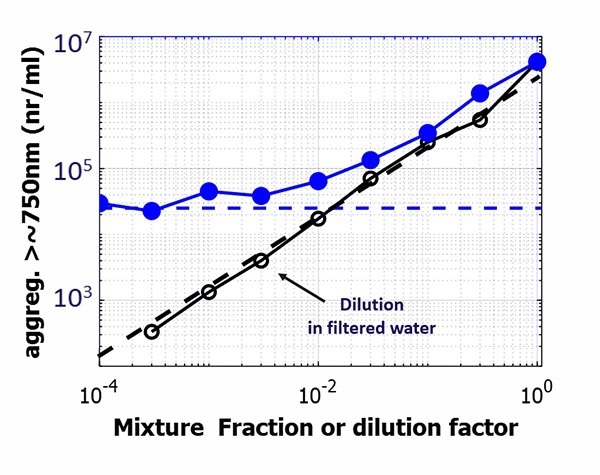
Figure 4. Aggregate concentrations for a strongly aggregated BSA solution, mixed in different fractions with a BSA solution with residual aggregates (blue data) or diluted with filtered water (black data). The mixture fraction or dilution factor extend over almost 4 decades to illustrate limits. Concentrations correspond to aggregates exceeding an estimated size of ~750nm. Image Credit: InProcess-LS
Conclusion
In summary, the unique combination of PhaSR-DLS and LPD in the NanoFlowSizer effectively tracks both submicron and rare subvisible protein aggregates, formed here during peristaltic pumping.
These complementary data -usually requiring multiple instruments- facilitate protein downstream processing development and understanding the aggregation state of protein formulations. A near linear increase in aggregate concentration of both types is seen on extended circulation, underscoring the impact of mechanical stress on protein stability.
The integrated, non-invasive measurement employed here provides real-time process insights, helping to detect and mitigate aggregation risks. The method can advance protein DSP by reducing complexity, costs, and boosting efficiency, while safeguarding product quality.
Acknowledgments
Produced from materials originally authored by Rut Besseling, Jan-Piet Wijgergangs, and Nick Koumakis from InProcess-LSP in The Netherlands.
References
- W. Wang, “Protein aggregation and its inhibition in biopharmaceutics,” Int J Pharm, vol. 289, no. 1–2, pp. 1–30, Jan. 2005, doi: 10.1016/J.IJPHARM.2004.11.014.
- H. C. Mahler, W. Friess, U. Grauschopf, and S. Kiese, “Protein aggregation: Pathways, induction factors and analysis,” J Pharm Sci, vol. 98, no. 9, pp. 2909–2934, Sep. 2009, doi: 10.1002/JPS.21566/ASSET/66182FB5-76C5-42CD-BA73-36C76AF2BE9F/MAIN.ASSETS/GR2.JPG.
- C. J. Roberts, “Protein aggregation and its impact on product quality,” Curr Opin Biotechnol, vol. 30, pp. 211–217, Dec. 2014, doi: 10.1016/J.COPBIO.2014.08.001.
- N. B. Pham and W. S. Meng, “Protein aggregation and immunogenicity of biotherapeutics,” Int J Pharm, vol. 585, p. 119523, Jul. 2020, doi: 10.1016/J.IJPHARM.2020.119523.
- N. Deiringer and W. Friess, “Proteins on the Rack: Mechanistic Studies on Protein Particle Formation During Peristaltic Pumping,” J Pharm Sci, vol. 111, no. 5, pp. 1370–1378, May 2022, doi: 10.1016/J.XPHS.2022.01.035.
- R. Matthessen, R. Van Pottelberge, B. Goffin, and G. De Winter, “Impact of mixing and shaking on mRNA-LNP drug product quality characteristics,” Scientific Reports 2024 14:1, vol. 14, no. 1, pp. 1–11, Aug. 2024, doi: 10.1038/s41598-024-70680-4.
- T. Rooimans et al., “Development of a compounded propofol nanoemulsion using multiple non-invasive process analytical technologies,” Int J Pharm, vol. 640, p. 122960, Jun. 2023, doi: 10.1016/J.IJPHARM.2023.122960.
- R. Besseling and et al., “Real-Time Droplet Size Monitoring of Nano Emulsions During High Pressure Homogenization,” 2021. doi: 10.13140/RG.2.2.30640.28166.
- M. Sheybanifard et al., “Liposome manufacturing under continuous flow conditions: towards a fully integrated set-up with in-line control of critical quality attributes,” Lab Chip, vol. 23, no. 1, pp. 182–194, Dec. 2022, doi: 10.1039/D2LC00463A.
- L. Royer and et al., “Non-Invasive Particle Size Monitoring of Polymer-Based Vectors for Cell Transfection in Process Vessels,” https://www.news-medical.net/whitepaper/20250224/Non-Invasive-Particle-Size-Monitoring-of-Polymer-Based-Vectors-for-Cell-Transfection-in-Process-Vessels.aspx.
- N. ; H. M. W. Y. W. J.-P. S. C. B. R. Koumakis, “‘PhaSR-DLS’: a new advancement in Spatially Resolved DLS for enhanced inline and off-line nanoparticle sizing,” https://www.azonano.com/article.aspx?ArticleID=6749. Accessed: Sep. 24, 2024. [Online]. Available: https://www.azonano.com/article.aspx?ArticleID=6749
- M. Hermes and et al., “A new method for non-invasive or inline detection of aggregates and oversized particles in nanosuspensions.” Accessed: Mar. 22, 2025. [Online]. Available: https://www.news-medical.net/whitepaper/20241106/A-new-method-for-non-invasive-or-inline-detection-of-aggregates-and-oversized-particles-in-nanosuspensions.aspx
- T. B. Fanthom, C. Wilson, D. Gruber, and D. G. Bracewell, “Solid-Solid Interfacial Contact of Tubing Walls Drives Therapeutic Protein Aggregation During Peristaltic Pumping,” J Pharm Sci, vol. 112, no. 12, pp. 3022–3034, Dec. 2023, doi: 10.1016/J.XPHS.2023.08.012.
- T. B. Fanthom, “Mechanisms of Therapeutic Protein Aggregation During Peristaltic Pumping,” 2023.
- C. M. Sorensen, “Q-space analysis of scattering by particles: A review,” J Quant Spectrosc Radiat Transf, vol. 131, pp. 3–12, Dec. 2013, doi: 10.1016/J.JQSRT.2012.12.029.
- D. C. Ripple, M. J. Carrier, and J. R. Wayment, “Standards for the Optical Detection of Protein Particulates,” 2012. Accessed: Sep. 23, 2024. [Online]. Available: https://www.nist.gov/publications/standards-optical-detection-protein-particulates
- B. Tolla and D. Boldridge, “Distortion of Single-Particle Optical Sensing (SPOS) Particle Count by Sub-Countable Particles,” Particle & Particle Systems Characterization, vol. 27, no. 1–2, pp. 21–31, Dec. 2010, doi: 10.1002/PPSC.200900081.
Footnotes
1A monotonous approximation, similar to that in C. M. Sorensen's study,14 was employed for the backscattering intensity of protein aggregates. These aggregates are assumed here to have irregular shapes and a refractive index ~1.45. Note that the RI and standards for protein aggregate characterization is an active research field.15
2 Using a Flexicon PF7 peristaltic pump and 1.2mm Accusil Platinum cured tubing. Total volume of BSA suspension: ~100ml. The mean wall shear rate in the tubing away from the peristaltic rollers is ∼5000 s-1.
3 Based on Rayleigh approximation.
4Note that also for long-established single particle techniques, measurements of subvisible particles may be significantly biased due to presence of submicron or ‘sub countable’ particles.16
About InProcess-LSP
InProcess-LSP, headquartered in Oss at Pivot Park, is a rapidly growing, innovative company founded in 2014. Backed by a team of in-house experts—comprising physicists, chemists, and software engineers—InProcess-LSP is at the forefront of nanotechnology solutions. The company’s leading product, the NanoFlowSizer, is a cutting-edge instrument designed to deliver inline, real-time measurements of nanoparticles in solution, making it indispensable across various industries.
Utilizing Spatially Resolved Dynamic Light Scattering (SR-DLS) technology, the NanoFlowSizer enables accurate characterization of nanoparticles in flowing liquids, providing critical data such as hydrodynamic diameter, polydispersity index (PDI), and D90 within seconds.
This state-of-the-art instrument empowers both scientists and industries by offering a robust solution for analyzing nanoparticle properties, paving the way for breakthroughs in product development, improved formulations, and pioneering applications.
Innovators in Process Analytical Technology and nanoparticle characterization.
With their strong background in process analytics as well as many years of academic and industrial experience InProcess offer a highly skilled and experienced team of scientists and process specialists addressing the needs of your PAT and nanotechnology challenges.
Sponsored Content Policy: News-Medical.net publishes articles and related content that may be derived from sources where we have existing commercial relationships, provided such content adds value to the core editorial ethos of News-Medical.Net which is to educate and inform site visitors interested in medical research, science, medical devices and treatments.