The NanoDrop™ Ultra Microvolume UV-Vis spectrophotometers and fluorometers from Thermo Scientific™ deliver rapid, straightforward protein analysis.
Proteins can be easily quantified using only 1 to 2 µL sample volumes via a microvolume pedestal and several pre-programmed protein applications, all without the need for error-prone dilutions.
Reproducibility for bovine serum albumin (BSA) is generally a standard deviation of ±0.03 mg/mL for concentrations between 0.03 and 10 mg/mL. Above 10 mg/mL, reproducibility is commonly ±2% coefficient of variation (%CV).
NanoDrop Ultra spectrophotometers can quantify proteins accurately and reproducibly. These instruments accommodate a broad measurement range of 0.03 mg/mL to 820 mg/mL (BSA).
Method
The NanoDrop Ultra instrument’s protein specifications were assessed and verified against two reference instruments: a Thermo Scientific™ NanoDrop™ One Spectrophotometer and a cuvette-based Thermo Scientific™ Evolution™ One Plus Spectrophotometer.
A dilution series of BSA (Sigma Aldrich, A7284) was prepared to yield a concentration range of 0.75 mg/mL to 15 mg/mL. Phosphate-buffered saline (PBS) was used as the diluent (samples 1 to 4).
A further dilution series of 70 mg/mL to 300 mg/mL was created using potassium hydrogen phthalate (KHP) (Thermo Scientific Chemicals, 424061000). This was used because its UV spectrum mimics that of purified proteins, exhibiting a peak at 280 nm (samples 5 to 7).
KHP was appropriate for this concentration range due to BSA’s tendency to become extremely viscous at high concentrations, introducing challenges to accurate pipetting. Measures of replicates of 10 2 µL samples were carried out, using both the NanoDrop Ultra and NanoDrop One spectrophotometers.
A low concentration range of 0.03 mg/mL to 1.5 mg/mL was tested before being compared against the Evolution One Plus reference instrument.
This involved measuring replicates of 10 2 µL samples on the NanoDrop Ultra instrument and triplicates of 2 mL on the Evolution One Plus instrument via a 1 cm quartz cuvette.
Samples on the NanoDrop instruments were measured using the Protein A280 application for each dilution series. “BSA” was selected as the sample type to ensure the correct E1% of 6.7 was applied for use in Beer’s Law.
Absorbance was measured using the Evolution One Plus instrument’s Fixed application with a 280 nm analysis wavelength, one-second integration time, and 1 nm bandwidth. Next, the standard deviation, average, and %CV were calculated for each sample.
Table 1. Average concentrations of serial dilutions of BSA (samples 1–4) and KHP (samples 5–7) measured on the NanoDrop One and the NanoDrop Ultra spectrophotometers. Each sample was averaged from replicates of 10, and the standard deviation (mg/mL) and %CV are both reported. Source: Thermo Fisher Scientific - UV-Vis Spectroscopy
| |
NanoDrop One spectrophotometer |
NanoDrop Ultra Spectrophotometer |
| Sample name |
Concentration
(mg/mL) |
Standard Deviation
(mg/mL) |
%CV |
Concentration
(mg/mL) |
Standard deviation
(mg/mL) |
%CV |
| Sample 1 |
0.74 |
0.01 |
1.574 |
0.75 |
0.01 |
1.893 |
| Sample 2 |
1.48 |
0.02 |
1.411 |
1.52 |
0.02 |
1.050 |
| Sample 3 |
7.42 |
0.01 |
0.185 |
7.49 |
0.01 |
0.151 |
| Sample 4 |
15.13 |
0.08 |
0.493 |
15.23 |
0.03 |
0.205 |
| Sample 5 |
71.6 |
0.3 |
0.488 |
70.4 |
0.2 |
0.323 |
| Sample 6 |
147.8 |
0.7 |
0.447 |
144.9 |
0.4 |
0.309 |
| Sample 7 |
299.8 |
0.8 |
0.274 |
293 |
1 |
0.416 |
Table 2. Reported concentration for each replicate measurement from the NanoDrop Ultra spectrophotometer. Provided at the bottom of the table are the average, standard deviation, and %CV for each sample. Source: Thermo Fisher Scientific - UV-Vis Spectroscopy
| Sample |
1 |
2 |
3 |
4 |
5 |
6 |
7 |
| Replicate 1 |
0.736 |
1.529 |
7.479 |
15.208 |
70.342 |
145.366 |
293.311 |
| Replicate 2 |
0.753 |
1.521 |
7.498 |
15.210 |
70.326 |
144.473 |
294.268 |
| Replicate 3 |
0.773 |
1.522 |
7.505 |
15.204 |
70.444 |
144.788 |
292.169 |
| Replicate 4 |
0.754 |
1.511 |
7.483 |
15.208 |
70.169 |
144.702 |
293.911 |
| Replicate 5 |
0.766 |
1.495 |
7.468 |
15.262 |
70.756 |
145.025 |
290.744 |
| Replicate 6 |
0.761 |
1.498 |
7.494 |
15.192 |
70.433 |
144.483 |
291.915 |
| Replicate 7 |
0.759 |
1.520 |
7.491 |
15.209 |
70.745 |
144.592 |
294.352 |
| Replicate 8 |
0.725 |
1.493 |
7.500 |
15.277 |
70.138 |
145.575 |
292.672 |
| Replicate 9 |
0.758 |
1.541 |
7.500 |
15.248 |
70.353 |
144.411 |
293.628 |
| Replicate 10 |
0.748 |
1.523 |
7.491 |
15.267 |
70.104 |
145.516 |
291.687 |
| Average (mg/mL) |
0.75 |
1.52 |
7.49 |
15.23 |
70.4 |
144.9 |
293 |
| Standard deviation (mg/mL) |
0.01 |
0.02 |
0.01 |
0.03 |
0.2 |
0.4 |
1 |
| %CV |
1.893 |
1.050 |
0.151 |
0.205 |
0.323 |
0.309 |
0.416 |
Results
Table 1 provides the standard deviation, mean, and %CV for samples 1–7 of the BSA and KHP dilution series.
Table 2 shows each sample replicate measured on the NanoDrop Ultra spectrophotometer.
Standard deviations were found to be well below the specified limit of 0.03 mg/mL for samples 1 to 3, with 0.016 mg/mL determined to be the highest amount of deviation.
Samples featuring concentrations greater than 10 mg/mL (samples 4 to 7) also exhibited %CV below the 2% limit, with the highest being 0.42%.
The linearity curve displayed in Figure 1 shows that the NanoDrop One and the NanoDrop Ultra spectrophotometers show a strong correlation in sample concentrations, as evidenced by an R2 of 1.000.
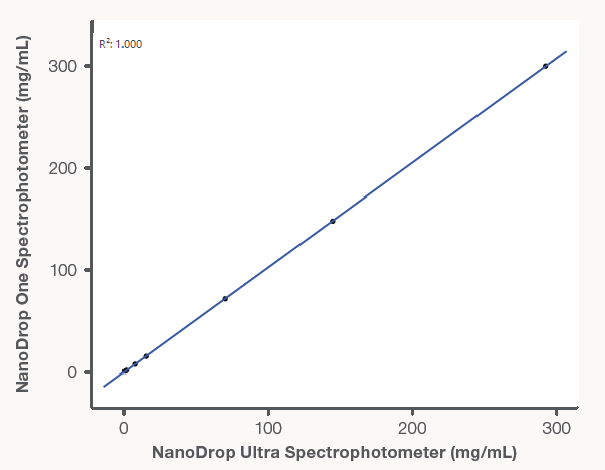
Figure 1. Linearity comparison between the NanoDrop One spectrophotometer and the NanoDrop Ultra spectrophotometer. The regression line (R2 = 1.000) indicates sample concentration measurements were well correlated. Image Credit: Thermo Fisher Scientific - UV-Vis Spectroscopy
Table 3. Average concentrations and standard deviations for each sample in the low concentration range (0.03 mg/mL to 1.5 mg/mL). The samples from the Evolution One Plus spectrophotometer were averaged from triplicates, while those from the NanoDrop Ultra spectrophotometer were averaged from replicates of 10. Source: Thermo Fisher Scientific - UV-Vis Spectroscopy
|
Evolution One Plus spectrophotometer |
NanoDrop Ultra spectrophotometer |
| Sample name |
Concentration
(mg/mL) |
Standard deviation
(mg/mL) |
Concentration
(mg/mL) |
Standard deviation
(mg/mL) |
| Sample 1 |
1.565 |
0.000 |
1.56 |
0.01 |
| Sample 2 |
1.180 |
0.001 |
1.1 |
0.02 |
| Sample 3 |
0.766 |
0.000 |
0.770 |
0.007 |
| Sample 4 |
0.143 |
0.000 |
0.14 |
0.01 |
| Sample 5 |
0.026 |
0.000 |
0.031 |
0.008 |
The NanoDrop Ultra instrument’s measured low concentration range (0.03 mg/mL to 1.5 mg/mL) was compared with the concentrations measured on the Evolution One Plus instrument.
Table 3 lists each sample’s average and standard deviation. The highest standard deviation from the NanoDrop Ultra instrument was determined to be 0.02 mg/mL, below the specified limit of 0.03 mg/mL.
Figure 2 features a linearity curve comparing the two instruments. The regression line’s R2 (1.000) confirms excellent alignment between the concentrations reported by the NanoDrop Ultra spectrophotometers and those reported by the Evolution One Plus.
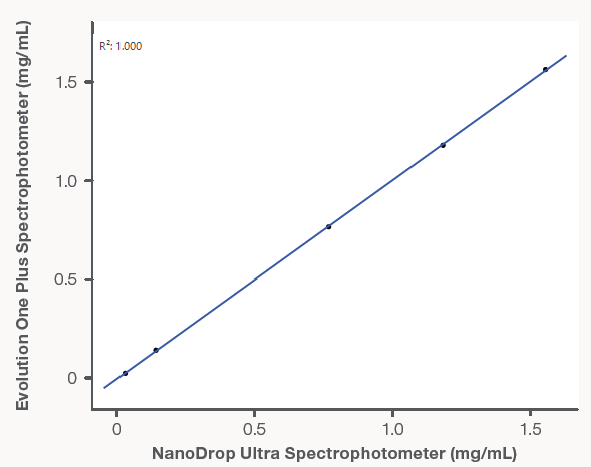
Figure 2. Linearity comparison of the Evolution One Plus and NanoDrop Ultra spectrophotometers. The R2 value of the regression line (1.000) indicates excellent correlation between reported sample concentrations. Image Credit: Thermo Fisher Scientific - UV-Vis Spectroscopy
Conclusions
The study presented here confirms that the NanoDrop Ultra spectrophotometer offers excellent linearity and reproducibility when used to determine purified protein concentrations.
The results provided by the NanoDrop Ultra instrument were compared against reference spectrophotometers, highlighting that these were well aligned, as evidenced by R2 values of 1.000 for the low- and full-range protein concentrations.
The NanoDrop Ultra spectrophotometer’s efficiency when quantifying protein samples is proven by its pre-programmed applications, rapid measurement time, and the absence of required dilutions.
Dilutions that are typical for cuvette-based spectrophotometers are rendered unnecessary by the instrument’s wide dynamic range of 0.03 mg/mL to 820 mg/mL for BSA proteins.
A NanoDrop Ultra instrument can be easily implemented into the protein quantification workflow, saving valuable resources and time in the laboratory.
About Thermo Fisher Scientific - UV-Vis Spectroscopy
UV-Vis Spectrometers overview
Scientists can count on our broad range of ultraviolet (UV) and visible (Vis) spectrophotometers to deliver reliable, accurate data. The Thermo Scientific SPECTRONIC 200, GENESYS, and Evolution product lines are designed to streamline measurements, providing consistent, high-quality results, time after time. Additionally, the innovative Thermo Scientific NanoDrop microvolume family of instruments has been helping scientists accelerate the pace of discovery for over 20 years. From classroom teaching to routine measurements to discovery of the next scientific breakthrough, our line of spectrophotometers is designed to fit into any modern laboratory.
Sponsored Content Policy: News-Medical.net publishes articles and related content that may be derived from sources where we have existing commercial relationships, provided such content adds value to the core editorial ethos of News-Medical.net, which is to educate and inform site visitors interested in medical research, science, medical devices and treatments.