Cell image analysis software is a potent tool for high-content imaging that digitizes and analyzes intricate experiment data. Users may quickly access various evaluation systems, ranging from 3D culture systems to live imaging, and use the machine learning features of the cell tracing software to significantly improve target detection and reduce slow turnaround times.
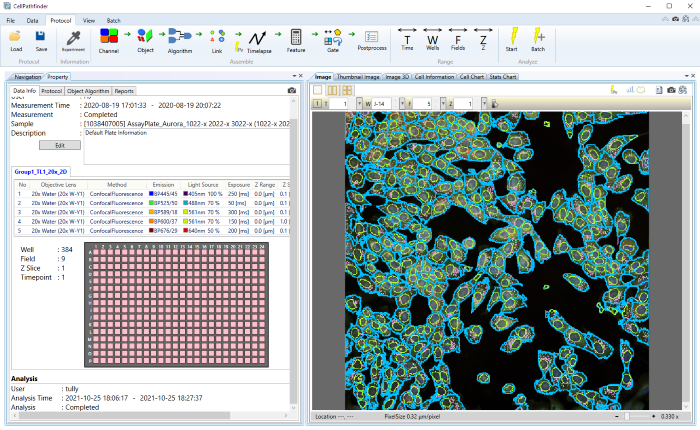
Image Credit: Yokogawa Life Science
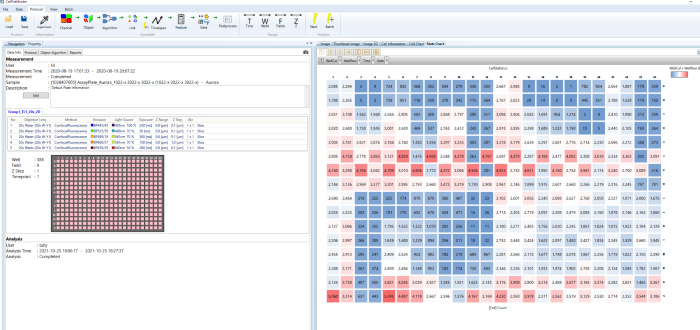
Image Credit: Yokogawa Life Science
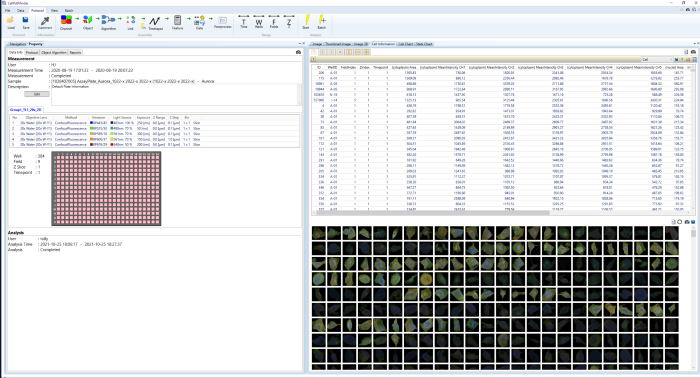
Image Credit: Yokogawa Life Science
- A user-friendly interface guides users through procedures
- Process success is continuously improved via machine learning
- Offers a wealth of analytical tools for customizing study
- Compatible with Total Solutions
- Supports label-free samples
- Offers several graphing choices and a simple, intuitive user interface
CellPathfinder resolves difficulties
For screening
CellPathfinder's cellular imaging technology eliminates screening obstacles.
Features include:
- A dedicated interface for viewing several samples makes image comparison simple, increasing efficiency
- Advanced AI analysis is made accessible with simple operations, even for beginners
- Various graph-generating features, as well as simple image and video production, reduce problems while reporting
For cancer research and regenerative medicine screening
CellPathfinder offers top HCA using proprietary analysis techniques.
Features include:
- Yokogawa’s unique image creation technique, “CE Bright Field”, enables label-free examination of materials that do not need to be stained
- Newly created user-friendly machine learning (standard function) simplifies the detection of previously complex occurrences
- Detection of unusual events (CTC, etc.) at great speed and accuracy
Applications
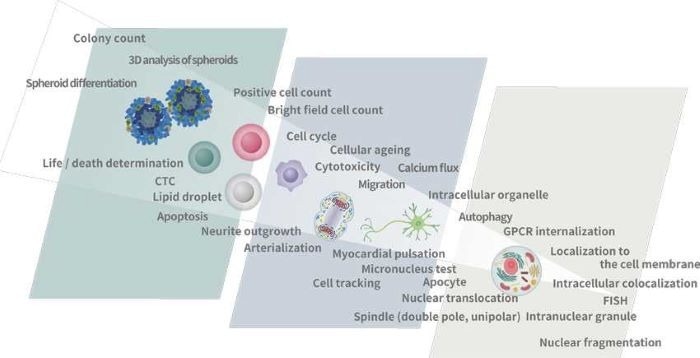
Image Credit: Yokogawa Life Science
Easily analyze data
Simplify workflow from images to analysis and graphs
- Display image data
- Easily compare images between wells
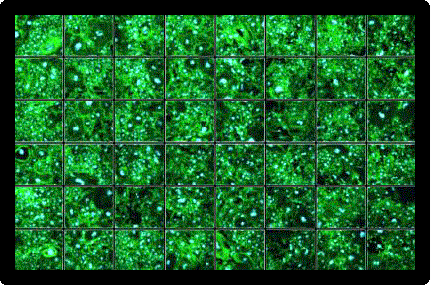
Image Credit: Yokogawa Life Science
- Load and execute analysis protocol
- Graphical icons are easy to grasp
- Select a predefined template for the analysis
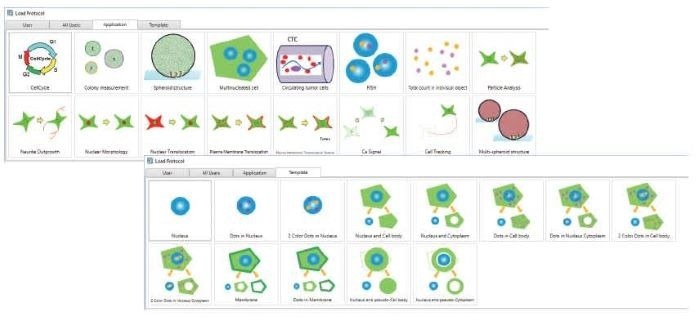
Image Credit: Yokogawa Life Science
- Gating
- Gating the feature value data of recognized objects allows for the extraction of specific populations
- Further analysis can be done on the extracted populations
Image Credit: Yokogawa Life Science
- Make the graphs
- Numerous graph possibilities for displaying the outcomes
- By clicking on data points, the graph's visual check feature allows for a rapid check of the images
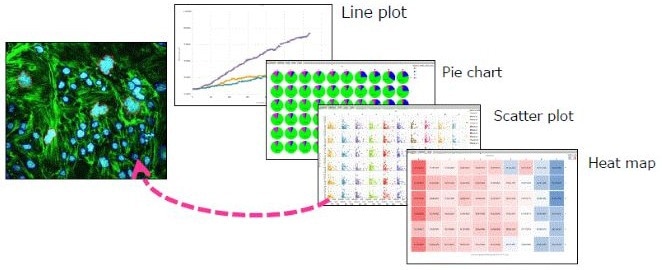
Image Credit: Yokogawa Life Science
- To examine further details - list the profiles of interesting cells
- Clicking on cells allows users to collect images and numerical data
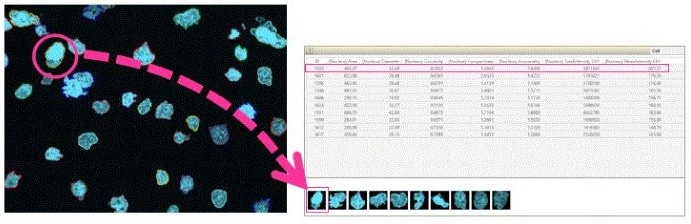
Image Credit: Yokogawa Life Science
Basic analysis functions
3D analysis
Image Credit: Yokogawa Life Science
Z-stack image analysis in three dimensions. Quantifying an object's volume and position in three dimensions is possible.
Label-free analysis
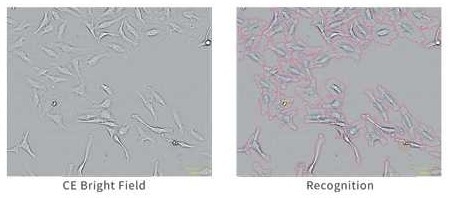
Image Credit: Yokogawa Life Science
Images produced using CE Bright Field technology can identify cells without labeling.
Phenotype analysis removes time, expense, and fluorescence labeling-related impacts on cells.
Image stitching
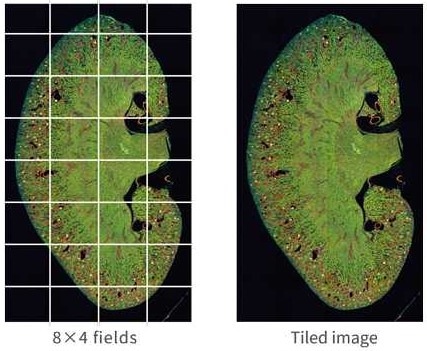
Image Credit: Yokogawa Life Science
Image-stitching generates tiled images, which are then examined to enable reliable quantification. Spheroids, tissue slices, and neurites are all excellent candidates for cross-disciplinary analyses.
Support for downsampling
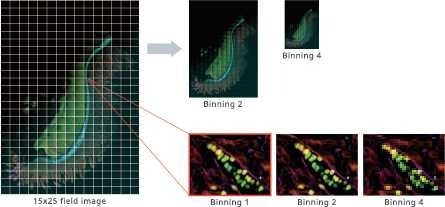
Image Credit: Yokogawa Life Science
Rapid analysis is feasible when spatial resolution is not required. It also makes it easier than ever to manage large tiled images.
Manual region definition
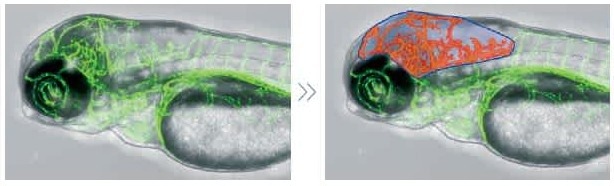
Data provided by Dr. Yasuhito Shimada, Mie University Graduate School of Medicine.
It is feasible to manually designate investigation zones for complicated patterns that are challenging to detect with automated image processing. Viewing the morphology in the defined locations makes analysis easier.
EC50/IC50 calculation (deep image response)

Image Credit: Yokogawa Life Science
Using whole images, this function allows for the thorough quantification of complicated phenotypes. Simple process of entering compound concentration data and choosing positive and negative wells. There is no need for any process to segment cells.
Convenient graphing tools
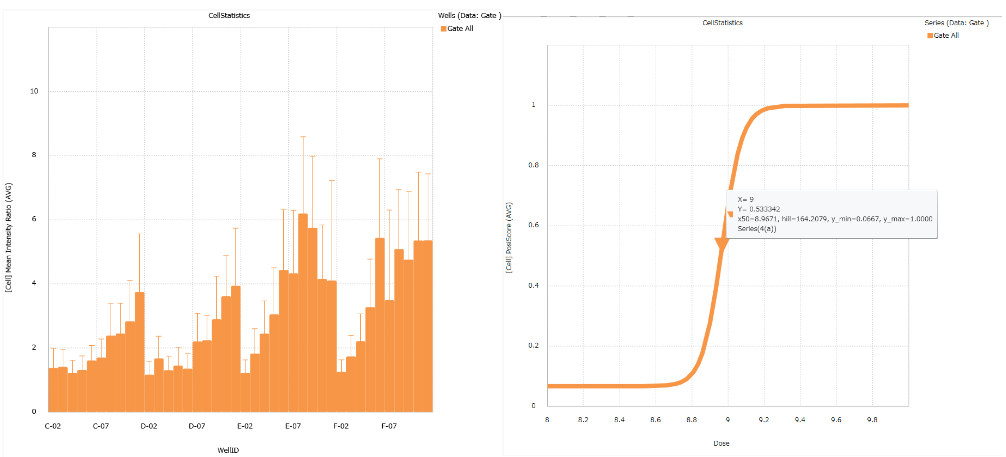
Image Credit: Yokogawa Life Science
The analysis findings can be shown as a bar chart, line chart, pie chart, scatter plot, heatmap, or histogram. The results can also be estimated using the EC50, IC50, and Z'-factor.
A variety of optional functions enable various analyses
The Basic Pack offers the fundamental functions to extract quantitative data on cell shape and brightness from fluorescence images. Furthermore, a range of analyses that are not possible with the basic pack become achievable by adding extra functions.
Contrast-enhanced bright field
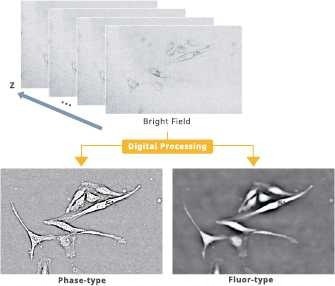
Image Credit: Yokogawa Life Science
Bright-field images can be converted into two distinct images utilizing Yokogawa’s “CE Bright Field” image generation technology.
Phase-type: Images obtained using techniques like phase-contrast microscopy.
It helps analyze cell phenotypes and high-precision contour identification.
Fluor-type: Images that resemble fluorescence; helpful for nuclear identification, etc.
Machine Learning
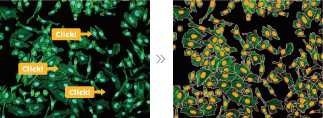
Image Credit: Yokogawa Life Science
Machine learning features provide objective digitization in appearance-based experiment evaluation. Furthermore, automated shape recognition can be accomplished by clicking on the shape users want the software to learn.
Same region over time
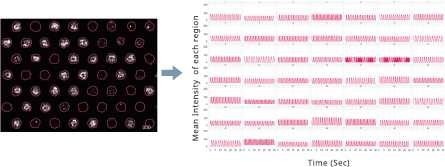
Image Credit: Yokogawa Life Science
The rapid calcium oscillations of cardiomyocyte and neuronal activity can be represented as waveforms by monitoring intensities in the same location throughout time lapse.
Object tracking
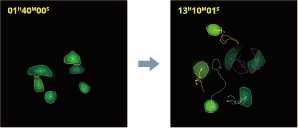
Image Credit: Yokogawa Life Science
Tracking individual cells allows users to watch dynamic cell activity. It can also follow daughter cells after cell division, which allows for cell lineage analysis.
Classification (Gate)
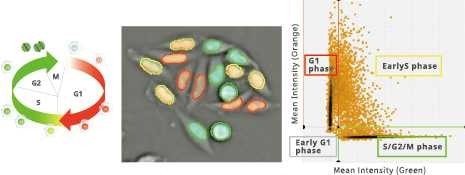
Image Credit: Yokogawa Life Science
Cells can be categorized into groups based on common characteristics. This function calculates the number of cells, cell ratios, and feature quantities in each cell group.
Cell recognition (deep area finder)
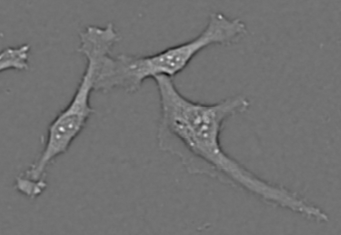
Original image. Image Credit: Yokogawa Life Science
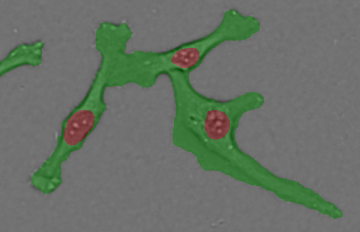
Recognition result. Image Credit: Yokogawa Life Science
Yokogawa's solution enables high-precision identification of specific locations, such as cells and intracellular organelles. This is useful when the accuracy of existing recognition techniques is insufficient, and expertise in image analysis is inaccessible.
Cell counts (deep cell detector)
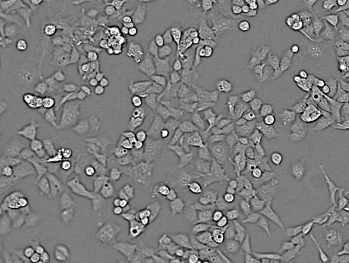
Original image. Image Credit: Yokogawa Life Science
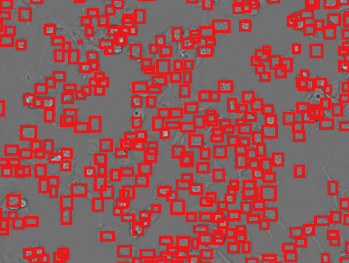
Recognition result. Image Credit: Yokogawa Life Science
- Intuitive cell counting
- Detect cells without using a complex image analysis procedure. It is particularly useful for examining high-density cultivated cells and bright-field analysis.
Cell classification (deep image gate)
Recognized cells can be classified into any category. Users can effortlessly classify complex phenotypes without specifying feature quantities.
Classification of cell cycle (G1, Early S, SG2M) using the Fucci system
- Added 0-6.8 μM etoposide to HeLa cells using Fucci
- 48-hour time lapse over 1-hour intervals at 10×; 488 nm and 561 nm
6.8 μM Etoposide. Image Credit: Yokogawa Life Science
Control. Image Credit: Yokogawa Life Science
Ratio of cells in each cell cycle at each well. Image Credit: Yokogawa Life Science
EC50/IC50 calculation (deep image response)
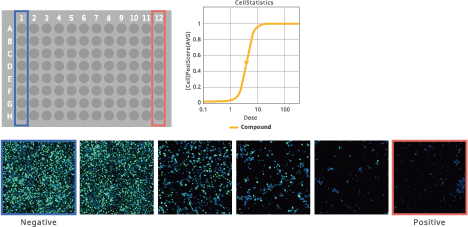
Image Credit: Yokogawa Life Science
This feature makes it possible to use whole images to measure complicated phenotypes thoroughly. Choosing positive and negative wells and entering information regarding compound concentration is simple. Segmentation of cells does not require any methodology.
Improved EC50 calculation
Convenient graphing tools
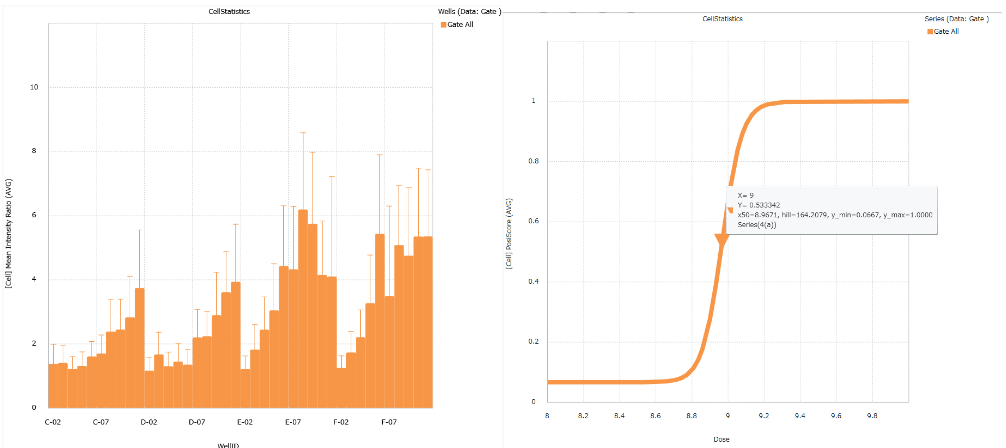
Image Credit: Yokogawa Life Science
An analysis's findings can be shown using a histogram, bar chart, scatter plot, pie chart, heatmap, and bar chart. The results can also be estimated using the EC50, IC50, and Z'-Factor.
Total solution - from imaging to analysis
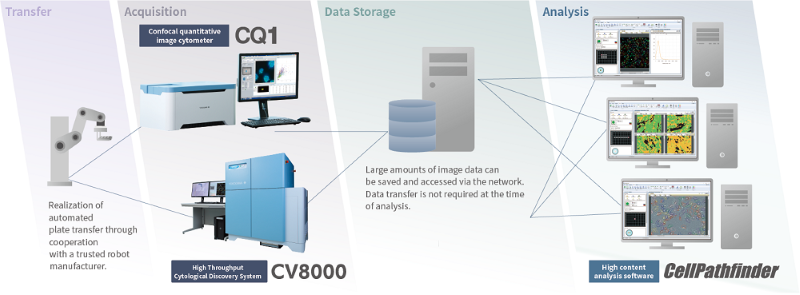
Image Credit: Yokogawa Life Science
Providing whole solutions, from measurement to analysis. Plate transport with a robot, measurement with CellVoyager or CQ1, data management using CellLibrarian, and image analysis with CellPathfinder. Yokogawa provides optimal combinations based on users' demands and budgets.
System configuration
- Workstation Software
- Displays
- Specifications of the workstation
- Model: Dell Precision
- CPU: Intel® Xeon
- Memory:128 GB
- HDD: System(C:)4TB Storage, (D:) 4TB
- OS: Windows® Microsoft Windows10 IoT Enterprise
- GPU: System(C:)Quadro K620 or Quadro P620 (High-performance GPU is not selected.), Quadro RTX5000 (High-performance GPU is selected.)