We are Anna Sigríður Islind and María Óskarsdóttir assistant professors at the department of computer science at Reykjavík University.
We actually do not have much background in modeling epidemiology, but Anna Sigríður is an expert on data-driven health and María is a data scientist who has studied mobility. Our main contribution to this project was based on this expertise.

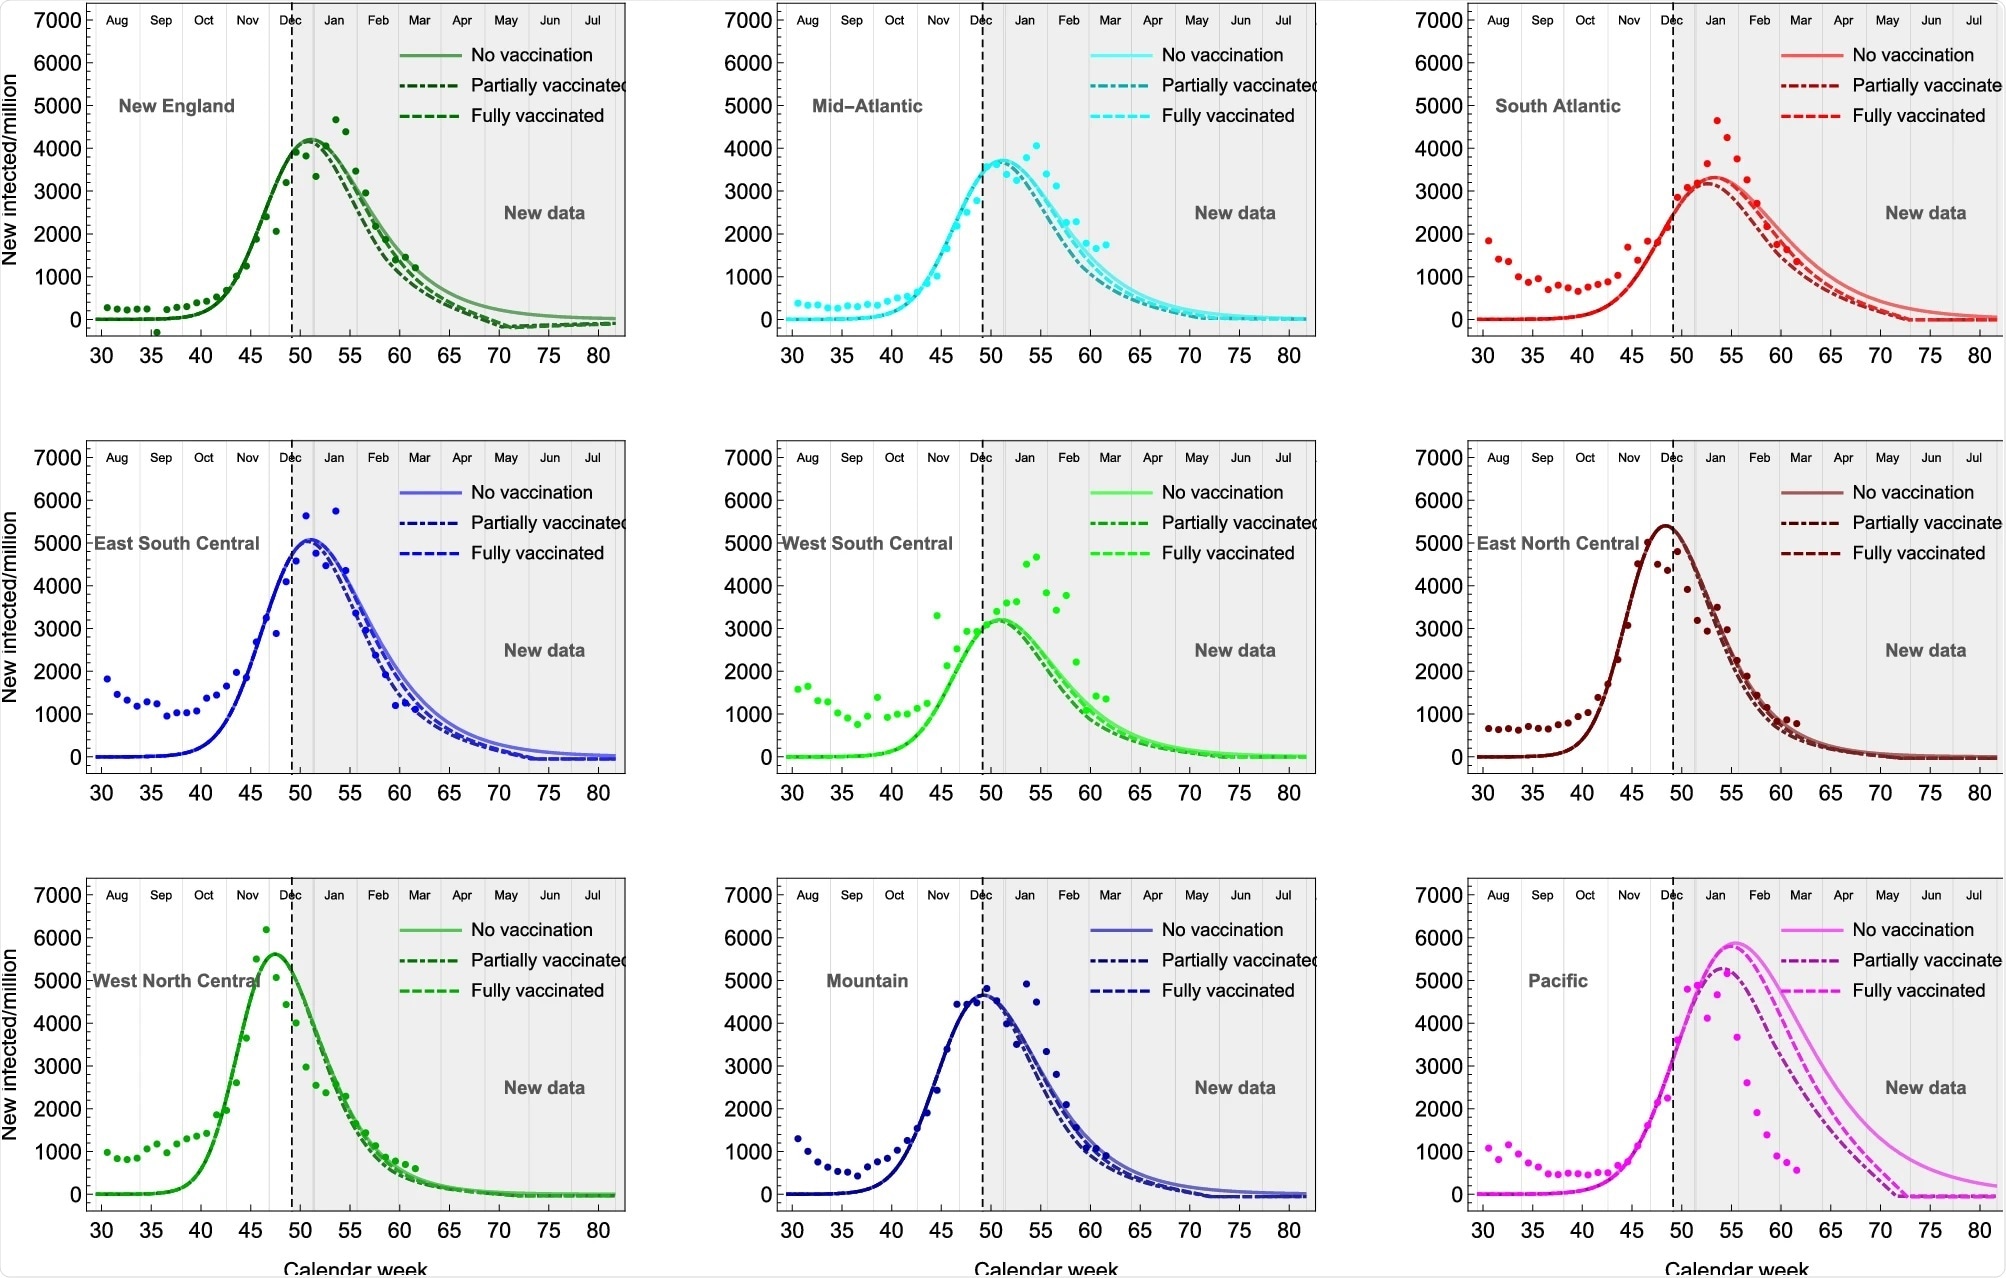
Study Results. Image Credit: Impact of US vaccination strategy on COVID-19 wave dynamics
Please can you describe the mathematical model you used within this study and its previous use in predicting the second wave of COVID-19 in the US?
The mathematical model is called the epidemic Renormalization Group and was developed by our co-authors for the COVID pandemic. It is a framework that provides a single first-order differential equation, which is apt to describe the time-evolution of the cumulative number of infected cases in an isolated region.
Our co-authors used this method to predict the second wave in the US before it occurred. It has also been used to model the infection curves in Europe.
Why is flight data useful in this setting and why did you choose this as a measure of human mobility?
The parameter of the model can be calibrated using real-life data, and in this study, we used flight data to estimate the flow of people between regions in the US. The flight data is a proxy for the mobility between regions in the US. At this time, the US was mostly closed, i.e. not many people were flying to the US, which meant that all the flight traffic happened inside the borders.
Therefore this was a good method to estimate this. Other types of open-source mobility data exist, e.g. from Apple and Google, but this only describes mobility within a region, such as a country or a city, but the flight data can be used to understand the flow between regions.
Could this study be repeated with more types of human mobility data to further determine the effect of human mobility on the current spread of the COVID-19 pandemic?
Yes. The eRG has been used with local mobility data (from Apple and Google) to calibrate the model within a region with good results, but this is the first time it was used with mobility data that captures the flow of people between regions.
Why are vaccination programs alone not enough to stop the current COVID-19 wave in the US and prevent further waves?
Our predictions were made at the end of December when vaccinations were only starting and the vaccination rate was very low. At that time the curve was growing in the US, which meant that there were a lot of infected people out there infecting others. And we saw that the current vaccination rate was not capable of curbing that curve.
Now the number of infections is going down, and a larger part of the population has been vaccinated, which greatly reduces the risk of another big wave. In addition, there is a lag between being vaccinated until being immune to the disease, which we saw in our results. Therefore it is important to maintain social distancing even after you have had your vaccine, and until a large enough part of the population has received their vaccine.

COVID-19 Vaccines. Image Credit: M-Foto/Shutterstock.com
How did you quantify the impact of social distancing, and how important do your results show it is?
What we saw in our results and helped us conclude, was that because of the delay between vaccination and immunity, social distancing is important to curb the current wave.
What do your results show about the importance of using real-world data to inform public health strategies?
The real-life data allowed us to calibrate the model more accurately, to get better predictions. Using such data is of utmost importance as it captures what is actually going on in the population. As we know, all models are bad but some are useful, and in this case, the model is more useful because it has some reality in it, provided by the real-life data.
But these types of data must fulfill some standards to be useful, for example, they need to be kept up to date and have good quality.
How could your results be used to ensure a successful vaccination strategy in the US at the moment?
At the moment, the vaccination rate in the US is quite good, and a large part of the population has been vaccinated, which is excellent. That is the goal you want to reach.
At the same time, the wave is going down. It is important to finish the vaccinations and at the same time remind people that they still have to be careful, wash their hands and wear their masks.
Taking into account the trajectory of the current US recovery, do you think your results suggest that more waves of the pandemic will occur?
It is difficult to say. There is always a risk that a new variant will arise that the current vaccine does not protect us against. It is also possible that we will have to get vaccinated for COVID-19 every year in the future, similar to the seasonal flu.
How could your findings be applied to the rest of the world?
Some yes. Especially findings related to the delay between vaccination and impact on wave dynamics. If the vaccinations start while there is a big wave, the effect will be limited on the current wave. And non-pharmaceutical measures will remain important to get the wave down.
How could models and data such as yours be used to deal with potential future pandemics effectively?
Never in history has there been so much data available on a pandemic or more research conducted in near real-time. All these efforts have taught us so much about the spread of viruses and the impact of a pandemic on society.
All this knowledge is vital to help us deal with future pandemics. Hopefully to curb the spread of a virus at the beginning to avoid worldwide effects.
What is the next step for your research?
We are looking towards Europe now, and especially the difference between vaccination strategies. We are comparing the effect of vaccinations of age groups on infection rates and the severity of illness.
In addition, we are applying our eRG framework to better understand the effect of the virus on various age groups.
Where can readers find more information?
About Dr. María Óskarsdóttir
Dr. María Óskarsdóttir is an Assistant Professor at the Department of Computer Science at Reykjavík University. She holds a Ph.D. in business analytics from KU Leuven, Belgium. She now works as an assistant professor in the Computer Science department at Reykjavík University.
Her research is focused on practical applications of data science and analytics whereby she leverages advanced machine learning techniques, network science, and various sources of data with the goal of increasing the impact of the analytics process and facilitating better usage of data science for decision making. María is the director of the Master's programs in Data Science and Applied Data Science at Reykjavík University.
About Dr. Anna Sigríður Islind
Dr. Anna Sigridur Islind is an Assistant Professor at the Department of Computer Science at Reykjavík University. She holds a Ph.D. in Informatics from University West in Sweden. She now works as an assistant professor in the Computer Science department at Reykjavík University. Her research is focused on applied information technology and emergent technology use.
More specifically her main focus is on the design, development, and use of digital technology in general and on the use of data for health benefits in particular. Her current role includes managing digital innovation in multi-disciplinary research projects and supervising students.