In metabolomics, confident compound identification is still a major difficulty. While efforts are in progress to improve the definitions and levels of metabolite identifications that were initially proposed by the MSI initiative,[1-4] it is evident that higher levels of confidence can be achieved by integrating orthogonal molecular features, sophisticated software tools, and exact measurement technology.
| Keywords |
Instrumentation and Software |
| Metabolomics |
MetaboScape 2.0 |
| Compound identification |
SmartFormula 3D |
| In-silico fragmentation |
MetFrag |
| Spectral Library |
Bruker HMDB Metabolite Library |
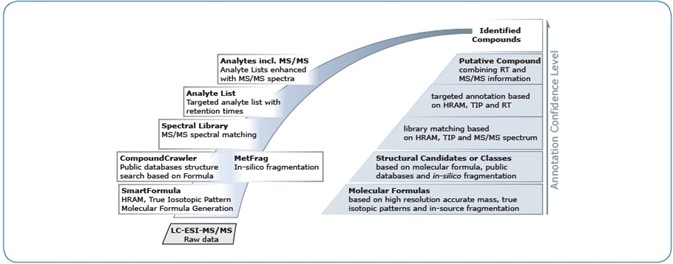
In this article, a single integrated software solution is presented for improving the confidence in identifications at various levels: structure, compound class, molecular formula, or verified targeted identification (Figure 1). This highly integrated functionality is applied to the innovative MetaboScape® 2.0 software.

Figure 1. In MetaboScape 2.0, compound identification is supported by a variety of (semi-)automated tools, which are highly integrated and enable the creation of annotations at increasing levels of specificity and confidence.
Molecular Formulas
Conventionally, molecular formulas are created on the basis of a single precursor mass, using a limited number of elements (usually CHNOPS) and the signified mass tolerance. Smart-FormulaTM enables further consideration of previous knowledge and other properties:
- “Golden Rules”[5]
- Senior and Lewis rule
- Element ratios
- Upper formula
- Element count probability
- In-source fragmentation
- True Isotopic PatternTM (TIP)
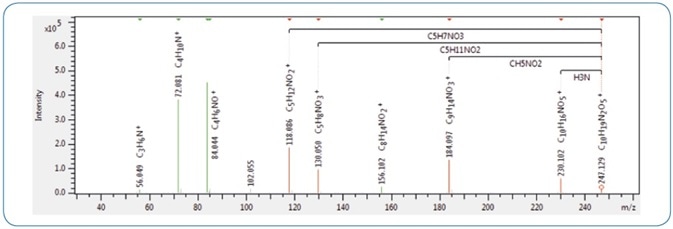
SmartFormula 3D offers a smart interface enabling users to annotate all monoisotopic peaks of an MS/MS spectrum using fragment formulas (see Figure 2).

Figure 2. An example MS/MS spectrum of gamma-glutamyl valine in SmartFormula 3D, highlighting characteristic fragments corresponding to the losses of NH3 and CH5NO2. These are indicators for gamma-glutamyl dipeptides rather than alpha-glutamyl dipeptides.[8]
Structural Candidates Search
The CompoundCrawlerTM tool available within MetaboScape can be used to obtain candidate structures of molecular formulas that are created previously. This tool queries a customizable type of public or private structural databases, including PubChem, KEGG, ChEBI, and ChemSpider. After that, identical structures can be evaluated using in-silico fragmentation.
MetFrag In-Silico Fragmentation
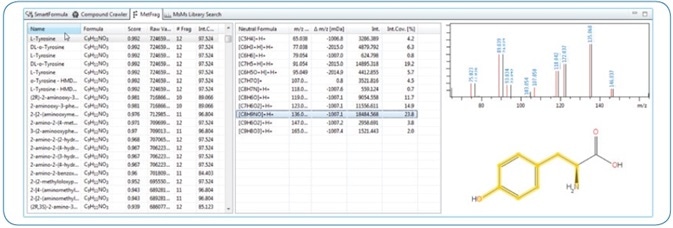
The MetFrag[6, 7] in-silico MS/MS fragmentation algorithm is incorporated into MetaboScape 2.0 and can be used to evaluate and score structural candidates from CompoundCrawler search results to obtained MS/MS spectral information. As shown in Figure 3, explained fragments are highlighted in the original compound structure.

Figure 3. Screenshot of a MetFrag result in MetaboScape. For the precursor, 182.0811 m/z SmartFormula generated three possible molecular formulas. Structural candidates for these were determined using CompoundCrawler (PubChem and custom MetaboScape AnalyteDB). For Tyrosine, 97.52% of the MS/MS intensity could be covered with explained fragments. The annotation was confirmed by an excellent Spectral Library (Bruker HMDB Metabolite Library) match and could be explained in SmartFormula 3D.
MS/MS Spectral Libraries
Users can generate or import MS/MS spectral libraries. After that, these can be used to annotate compounds, if the spectral similarity fulfills the user-defined thresholds. An interactive spectral library editor is incorporated into the innovative Metabo-Scape 2.0 software.
Targeted Analyte Lists
Analyte Lists are used to easily annotate the compounds with known retention times. If necessary, compounds can be associated with the entries of spectral libraries, so as to include MS/MS spectral matching. Consequently, Analyte Lists enable the integration of MS/MS, RT, and MS information for confident dereplication.
Conclusions
- The software has a comprehensive set of tools for performing compound annotation at all specificity levels
- For boosting confidence in compound ID, true isotopic pattern, HRAM, retention time, and MS/MS fragmentation are integrated
- All tools are combined to create application-specific workflows:
- CompoundCrawler embedded
- MS/MS spectral libraries matching and management
- MetFrag embedded
- SmartFormula 3D embedded
- AnalyteLists for targeted compound identification
Acknowledgements
Produced from materials originally authored by Nikolas Kessler; Heiko Neuweger; Verena Tellström, Aiko Barsch from Bruker Daltonik GmbH, Bremen, Germany
References
[1] Fiehn et al.; Metabolomics 2007, 3:175–178.
[2] Sumner et al.; Metabolomics 2007, 3:211–221.
[3] Sumner et al.; Metabolomics 2014, 6:1047–1049.
[4] Schymanski et al.; Environ. Sci. Technol. 2014, 48:2097−2098.
[5] Kind and Fiehn; BMC Bioinformatics 2007, 8:105.
[6] Wolf et al.; BMC Bioinformatics 2010, 11:148.
[7] Ruttkies et al.; J. Cheminf. 2016, 8:3.
[8] Harrison; J Mass Spectrom. 2013, 38:174–187.
About Bruker Life Sciences Mass Spectrometry

Discover new ways to apply mass spectrometry to today’s most pressing analytical challenges. Innovations such as Trapped Ion Mobility (TIMS), smartbeam and scanning lasers for MALDI-MS Imaging that deliver true pixel fidelity, and eXtreme Resolution FTMS (XR) technology capable to reveal Isotopic Fine Structure (IFS) signatures are pushing scientific exploration to new heights. Bruker's mass spectrometry solutions enable scientists to make breakthrough discoveries and gain deeper insights.
Sponsored Content Policy: News-Medical.net publishes articles and related content that may be derived from sources where we have existing commercial relationships, provided such content adds value to the core editorial ethos of News-Medical.Net which is to educate and inform site visitors interested in medical research, science, medical devices and treatments.